
Page 212 - Changing Living Spaces
P. 212
Masanori Takashima
100
90
80
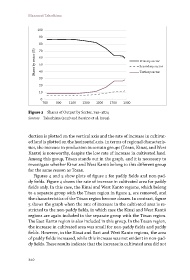
Shares by sector (%) 60 Primary sector
70
50
Secondary sector
40
30 Tertiary sector
20
10
0
700 900 1100 1300 1500 1700 1900
Figure 2 Shares of Output by Sector, 730–1874
Sources Takashima (2017) and Bassino et al. (2019).
duction is plotted on the vertical axis and the rate of increase in cultivat-
ed land is plotted on the horizontal axis. In terms of regional characteris-
tics, the increase in production in certain groups (Tōsan, Kinai, and West
Kantō) is noteworthy, despite the low rate of increase in cultivated land.
Among this group, Tōsan stands out in the graph, and it is necessary to
investigate whether Kinai and West Kantō belong to this different group
for the same reason as Tōsan.
Figures 4 and 5 show plots of figure 2 for paddy fields and non-pad-
dy fields. Figure 4 shows the rate of increase in cultivated area for paddy
fields only. In this case, the Kinai and West Kantō regions, which belong
to a separate group with the Tōsan region in figure 3, are removed, and
the characteristics of the Tōsan region become clearer. In contrast, figure
5 shows the graph when the rate of increase in the cultivated area is re-
stricted to the non-paddy fields, in which case the Kinai and West Kantō
regions are again included in the separate group with the Tōsan region.
The East Kantō region is also included in this group. In the Tōsan region,
the increase in cultivated area was small for non-paddy fields and paddy
fields. However, in the Kinai and East and West Kantō regions, the area
of paddy fields increased, while this increase was not evident in non-pad-
dy fields. These results indicate that the increase in cultivated area did not
210