Page 419 - Istenič Andreja, Gačnik Mateja, Horvat Barbara, Kukanja Gabrijelčič Mojca, Kiswarday Vanja Riccarda, Lebeničnik Maja, Mezgec Maja, Volk Marina. Ur. 2023. Vzgoja in izobraževanje med preteklostjo in prihodnostjo. Koper: Založba Univerze na Primorskem
P. 419
The Development of Strategies for Solving Arithmetic Word Problems
14
Jenny
Evelyn 5
?
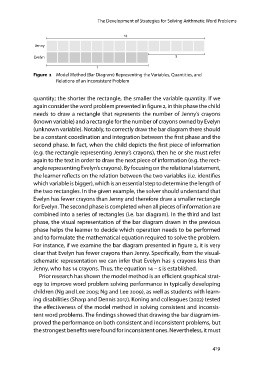
Figure 2 Model Method (Bar Diagram) Representing the Variables, Quantities, and
Relations of an Inconsistent Problem
quantity; the shorter the rectangle, the smaller the variable quantity. If we
again consider the word problem presented in figure 2, in this phase the child
needs to draw a rectangle that represents the number of Jenny’s crayons
(known variable) and a rectangle for the number of crayons owned by Evelyn
(unknown variable). Notably, to correctly draw the bar diagram there should
be a constant coordination and integration between the first phase and the
second phase. In fact, when the child depicts the first piece of information
(e.g. the rectangle representing Jenny’s crayons), then he or she must refer
again to the text in order to draw the next piece of information (e.g. the rect-
angle representing Evelyn’s crayons). By focusing on the relational statement,
the learner reflects on the relation between the two variables (i.e. identifies
which variable is bigger), which is an essential step to determine the length of
the two rectangles. In the given example, the solver should understand that
Evelyn has fewer crayons than Jenny and therefore draw a smaller rectangle
for Evelyn. The second phase is completed when all pieces of information are
combined into a series of rectangles (i.e. bar diagram). In the third and last
phase, the visual representation of the bar diagram drawn in the previous
phase helps the learner to decide which operation needs to be performed
and to formulate the mathematical equation required to solve the problem.
For instance, if we examine the bar diagram presented in figure 2, it is very
clear that Evelyn has fewer crayons than Jenny. Specifically, from the visual-
schematic representation we can infer that Evelyn has 5 crayons less than
Jenny, who has 14 crayons. Thus, the equation 14 – 5 is established.
Prior research has shown the model method is an efficient graphical strat-
egy to improve word problem solving performance in typically developing
children (Ng and Lee 2005; Ng and Lee 2009), as well as students with learn-
ing disabilities (Sharp and Dennis 2017). Koning and colleagues (2022) tested
the effectiveness of the model method in solving consistent and inconsis-
tent word problems. The findings showed that drawing the bar diagram im-
proved the performance on both consistent and inconsistent problems, but
the strongest benefits were found for inconsistent ones. Nevertheless, it must
419
14
Jenny
Evelyn 5
?
Figure 2 Model Method (Bar Diagram) Representing the Variables, Quantities, and
Relations of an Inconsistent Problem
quantity; the shorter the rectangle, the smaller the variable quantity. If we
again consider the word problem presented in figure 2, in this phase the child
needs to draw a rectangle that represents the number of Jenny’s crayons
(known variable) and a rectangle for the number of crayons owned by Evelyn
(unknown variable). Notably, to correctly draw the bar diagram there should
be a constant coordination and integration between the first phase and the
second phase. In fact, when the child depicts the first piece of information
(e.g. the rectangle representing Jenny’s crayons), then he or she must refer
again to the text in order to draw the next piece of information (e.g. the rect-
angle representing Evelyn’s crayons). By focusing on the relational statement,
the learner reflects on the relation between the two variables (i.e. identifies
which variable is bigger), which is an essential step to determine the length of
the two rectangles. In the given example, the solver should understand that
Evelyn has fewer crayons than Jenny and therefore draw a smaller rectangle
for Evelyn. The second phase is completed when all pieces of information are
combined into a series of rectangles (i.e. bar diagram). In the third and last
phase, the visual representation of the bar diagram drawn in the previous
phase helps the learner to decide which operation needs to be performed
and to formulate the mathematical equation required to solve the problem.
For instance, if we examine the bar diagram presented in figure 2, it is very
clear that Evelyn has fewer crayons than Jenny. Specifically, from the visual-
schematic representation we can infer that Evelyn has 5 crayons less than
Jenny, who has 14 crayons. Thus, the equation 14 – 5 is established.
Prior research has shown the model method is an efficient graphical strat-
egy to improve word problem solving performance in typically developing
children (Ng and Lee 2005; Ng and Lee 2009), as well as students with learn-
ing disabilities (Sharp and Dennis 2017). Koning and colleagues (2022) tested
the effectiveness of the model method in solving consistent and inconsis-
tent word problems. The findings showed that drawing the bar diagram im-
proved the performance on both consistent and inconsistent problems, but
the strongest benefits were found for inconsistent ones. Nevertheless, it must
419