
Page 15 - Changing Living Spaces
P. 15
An Introduction to the Living Spaces Concept
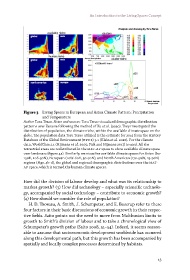
Figure 3 Living Spaces in European and Asian Climate Pattern: Precipitation
and Temperature
Author Toru Terao. Notes and sources: Toru Terao visualized demographic distribution
patterns over Eurasia following the method of Xu et al. (2020). They investigated the
distribution of population, the climate niche, within the available climate space on the
globe. The population data Toru Terao utilized is the estimate for 2015 from the History
Database of the Global Environment (HYDe) 3.1 (Klein et al. 2010). For the climate
data, WorldClim 2.1 (Hijmans et al. 2005; Fick and Hijmans 2017) is used. All the
terrestrial areas are redistributed in the MAt-AP space to show available climate space
over landmass (figure 4a). Similarly, we visualize available climate spaces for Asian (60-
150E, 10S-50N), European (10W-60E, 30-70N), and North American (170-50W, 25-70N)
regions (Figs. 4b-d), the global and regional demographic distributions over the MAt-
AP space, which is termed the human climate spaces.
How did the division of labour develop and what was its relationship to
market growth? (3) How did technology – especially scientific technolo-
gy, accompanied by social technology – contribute to economic growth?
(4) How should we consider the role of population?
H. D. Thoreau, A. Smith, J. Schumpeter, and E. Boserup refer to these
four factors in their basic discussions of economic growth in their respec-
tive fields. Saito points out the need to move from Malthusian limits to
growth to Smith’s division of labour and to take a chronological view of
Schumpeter’s growth paths (Saito 2008, 51–54). Indeed, it seems reason-
able to assume that socioeconomic development worldwide has occurred
along this developmental path, but this growth has been accompanied by
spatially and locally complex processes determined by habitats.
13