Page 33 - Fister jr., Iztok, and Andrej Brodnik (eds.). StuCoSReC. Proceedings of the 2015 2nd Student Computer Science Research Conference. Koper: University of Primorska Press, 2015
P. 33
ticular decision variables as follows:
Qi(t) = xi(Ub) − xi(Lb) · N (0, 1), (3)
Np
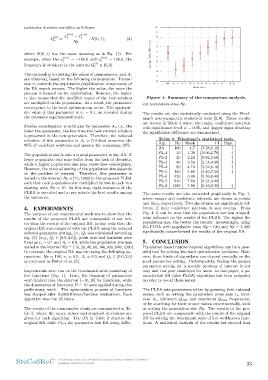
where N (0, 1) has the same meaning as in Eq. (1). For Figure 1: Summary of the comparison analysis.
example, when the xi(Lb) = −100.0 and xi(Ub) = 100.0, the ent population sizes Np.
frequency is obtained in the interval Q(it) ∈ [0, 2].
The results are also statistically evaluated using the Fried-
The rationality for setting the values of parameters ri and Ai man’s non-parametric statistical tests [2, 6]. These results
are obtained, based on the following consideration. Param- are shown in Table 3 where the ranks, confidence intervals
eter ri controls the exploration/exploitation components of with significance level α = 0.05, and dagger signs denoting
the BA search process. The higher the value, the more the the significance difference are summarized.
process is focused on the exploitation. However, the higher
ri also means that the modified copies of the best solution Table 3: Friedman’s statistical tests.
are multiplied in the population. As a result, the premature
convergence to the local optimum can occur. The appropri- Alg. Np Rank CI Sign.
ate value of this parameter is ri = 0.1, as revealed during
the extensive experimental work. BA 100 4.7 [3.28,6.12] †
Similar consideration is valid also for parameter Ai; i.e., the PL-1 10 1.36 [-0.06,2.78] †
lower the parameter, the less time the best current solution
is preserved in the new generation. Therefore, the rational PL-2 20 2.24 [0.82,3.66] †
selection of this parameter is Ai = 0.9 that preserves the
90% of each best solutions and ignores the remaining 10%. PL-3 40 3.56 [2.14,4.98] †
The population size is also a crucial parameter in the BA. A PL-4 80 4.74 [3.32,6.16] †
lower population size may suffer from the lack of diversity,
while a higher population size may cause slow convergence. PL-5 160 5.88 [4.46,7.30] †
However, the rational setting of the population size depends
on the problem of interest. Therefore, this parameter is PL-6 320 6.98 [5.56,8.40]
varied in the interval Np ∈ [10, 1280] in the proposed PLBA
such that each population size multiplied by two in each run PL-7 640 7.66 [6.24,9.08]
starting with Np = 10. In this way, eight instances of the
PLBA is executed and a user selects the best results among PL-8 1280 7.88 [6.46,9.30] ‡
the instances.
The same results are also presented graphically in Fig. 1,
4. EXPERIMENTS where ranges and confidence intervals are shown as points
and lines, respectively. Two algorithms are significantly dif-
The purpose of our experimental work was to show that the ferent, if their confidence intervals do not overlap. From
results of the proposed PLBA are comparable if not bet- Fig. 1, it can be seen that the population size has a signif-
ter than the results of the original BA. In line with this, the icant influence on the results of the PLBA. The higher the
original BA was compared with the PLBA using the rational population size, the better the results. Interestingly, using
selected parameter setting, i.e., Qi was calculated according the PLBA with population sizes Np = 640 and Np = 1, 280
Eq. (3) (e.q., Qi ∈ [0.0, 2.0]), pulse rate and loudness were significantly outperformed the results of the original BA.
fixed as ri = 0.1 and Ai = 0.9, while the population size was
varied in the interval N p = {10, 20, 40, 80, 160, 320, 640, 1280}. 5. CONCLUSION
In contrast, the original BA was run using the following pa-
rameters: Np = 100, ri = 0.5, Ai = 0.5 and Qi ∈ [0.0, 2.0] Population-based nature-inspired algorithms can be a pow-
as proposed in Fister et al. [3]. erful tool for solving the hard optimization problems. How-
ever, these kinds of algorithms can depend crucially on the
Experiments were run on the benchmark suite consisting of good parameter setting. Unfortunately, finding the proper
five functions (Fig. 1). Here, the domains of parameters parameter setting for a specific problem of interest is not
were limited into the interval [−10, 10] by functions, while easy and can pose challenges for users. In this paper, a pa-
the dimensions of functions D = 10 were applied during this rameterless BA (also PLBA) algorithm has been proposed
preliminary work. The optimization process of functions in order to avoid these issues.
was stopped after 10,000 fitness/function evaluations. Each
algorithm was run 25 times. The PLBA sets parameters either by guessing their rational
values, such as setting the parameters pulse rate ri, loud-
The results of the comparative study are summarized in Ta- ness Ai, minimum Qmin and maximum Qmax frequencies,
ble 2, where the mean values and standard deviations are or by searching for their proper values experimentally, such
given for each algorithm. The BA in Table 2 denotes the as setting the population size Np. The results of the pro-
original BA while PL-i the parameter-less BA using differ- posed PLBA are comparable with the results of the original
BA by solving the benchmark suite of five well-known func-
tions. A statistical analysis of the results has showed that
StuCoSReC Proceedings of the 2015 2nd Student Computer Science Research Conference 33
Ljubljana, Slovenia, 6 October
Qi(t) = xi(Ub) − xi(Lb) · N (0, 1), (3)
Np
where N (0, 1) has the same meaning as in Eq. (1). For Figure 1: Summary of the comparison analysis.
example, when the xi(Lb) = −100.0 and xi(Ub) = 100.0, the ent population sizes Np.
frequency is obtained in the interval Q(it) ∈ [0, 2].
The results are also statistically evaluated using the Fried-
The rationality for setting the values of parameters ri and Ai man’s non-parametric statistical tests [2, 6]. These results
are obtained, based on the following consideration. Param- are shown in Table 3 where the ranks, confidence intervals
eter ri controls the exploration/exploitation components of with significance level α = 0.05, and dagger signs denoting
the BA search process. The higher the value, the more the the significance difference are summarized.
process is focused on the exploitation. However, the higher
ri also means that the modified copies of the best solution Table 3: Friedman’s statistical tests.
are multiplied in the population. As a result, the premature
convergence to the local optimum can occur. The appropri- Alg. Np Rank CI Sign.
ate value of this parameter is ri = 0.1, as revealed during
the extensive experimental work. BA 100 4.7 [3.28,6.12] †
Similar consideration is valid also for parameter Ai; i.e., the PL-1 10 1.36 [-0.06,2.78] †
lower the parameter, the less time the best current solution
is preserved in the new generation. Therefore, the rational PL-2 20 2.24 [0.82,3.66] †
selection of this parameter is Ai = 0.9 that preserves the
90% of each best solutions and ignores the remaining 10%. PL-3 40 3.56 [2.14,4.98] †
The population size is also a crucial parameter in the BA. A PL-4 80 4.74 [3.32,6.16] †
lower population size may suffer from the lack of diversity,
while a higher population size may cause slow convergence. PL-5 160 5.88 [4.46,7.30] †
However, the rational setting of the population size depends
on the problem of interest. Therefore, this parameter is PL-6 320 6.98 [5.56,8.40]
varied in the interval Np ∈ [10, 1280] in the proposed PLBA
such that each population size multiplied by two in each run PL-7 640 7.66 [6.24,9.08]
starting with Np = 10. In this way, eight instances of the
PLBA is executed and a user selects the best results among PL-8 1280 7.88 [6.46,9.30] ‡
the instances.
The same results are also presented graphically in Fig. 1,
4. EXPERIMENTS where ranges and confidence intervals are shown as points
and lines, respectively. Two algorithms are significantly dif-
The purpose of our experimental work was to show that the ferent, if their confidence intervals do not overlap. From
results of the proposed PLBA are comparable if not bet- Fig. 1, it can be seen that the population size has a signif-
ter than the results of the original BA. In line with this, the icant influence on the results of the PLBA. The higher the
original BA was compared with the PLBA using the rational population size, the better the results. Interestingly, using
selected parameter setting, i.e., Qi was calculated according the PLBA with population sizes Np = 640 and Np = 1, 280
Eq. (3) (e.q., Qi ∈ [0.0, 2.0]), pulse rate and loudness were significantly outperformed the results of the original BA.
fixed as ri = 0.1 and Ai = 0.9, while the population size was
varied in the interval N p = {10, 20, 40, 80, 160, 320, 640, 1280}. 5. CONCLUSION
In contrast, the original BA was run using the following pa-
rameters: Np = 100, ri = 0.5, Ai = 0.5 and Qi ∈ [0.0, 2.0] Population-based nature-inspired algorithms can be a pow-
as proposed in Fister et al. [3]. erful tool for solving the hard optimization problems. How-
ever, these kinds of algorithms can depend crucially on the
Experiments were run on the benchmark suite consisting of good parameter setting. Unfortunately, finding the proper
five functions (Fig. 1). Here, the domains of parameters parameter setting for a specific problem of interest is not
were limited into the interval [−10, 10] by functions, while easy and can pose challenges for users. In this paper, a pa-
the dimensions of functions D = 10 were applied during this rameterless BA (also PLBA) algorithm has been proposed
preliminary work. The optimization process of functions in order to avoid these issues.
was stopped after 10,000 fitness/function evaluations. Each
algorithm was run 25 times. The PLBA sets parameters either by guessing their rational
values, such as setting the parameters pulse rate ri, loud-
The results of the comparative study are summarized in Ta- ness Ai, minimum Qmin and maximum Qmax frequencies,
ble 2, where the mean values and standard deviations are or by searching for their proper values experimentally, such
given for each algorithm. The BA in Table 2 denotes the as setting the population size Np. The results of the pro-
original BA while PL-i the parameter-less BA using differ- posed PLBA are comparable with the results of the original
BA by solving the benchmark suite of five well-known func-
tions. A statistical analysis of the results has showed that
StuCoSReC Proceedings of the 2015 2nd Student Computer Science Research Conference 33
Ljubljana, Slovenia, 6 October