Page 37 - Fister jr., Iztok, and Andrej Brodnik (eds.). StuCoSReC. Proceedings of the 2015 2nd Student Computer Science Research Conference. Koper: University of Primorska Press, 2015
P. 37
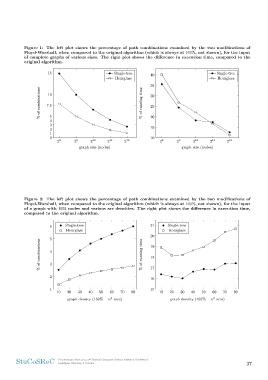
ure 1: The left plot shows the percentage of path combinations examined by the two modifications of
Floyd-Warshall, when compared to the original algorithm (which is always at 100%, not shown), for the input
of complete graphs of various sizes. The right plot shows the difference in execution time, compared to the
original algorithm.
15 Single-tree 40 Single-tree
Hourglass 35 Hourglass
30
% of combinations10 25
% of running time 20
7.5 15
29 210 211 212 10 29 210 211 212
5 graph size (nodes) graph size (nodes)
4 28
3
2
1
0
28
Figure 2: The left plot shows the percentage of path combinations examined by the two modifications of
Floyd-Warshall, when compared to the original algorithm (which is always at 100%, not shown), for the input
of a graph with 1024 nodes and various arc densities. The right plot shows the difference in execution time,
compared to the original algorithm.
6 Single-tree 21 Single-tree
Hourglass Hourglass
5 20
% of combinations 19
% of running time
4
18
3
17
2 16
1 20 30 40 50 60 70 80 15 20 30 40 50 60 70 80
10 graph density (100% = n2 arcs) 10 graph density (100% = n2 arcs)
StuCoSReC Proceedings of the 2015 2nd Student Computer Science Research Conference 37
Ljubljana, Slovenia, 6 October
Floyd-Warshall, when compared to the original algorithm (which is always at 100%, not shown), for the input
of complete graphs of various sizes. The right plot shows the difference in execution time, compared to the
original algorithm.
15 Single-tree 40 Single-tree
Hourglass 35 Hourglass
30
% of combinations10 25
% of running time 20
7.5 15
29 210 211 212 10 29 210 211 212
5 graph size (nodes) graph size (nodes)
4 28
3
2
1
0
28
Figure 2: The left plot shows the percentage of path combinations examined by the two modifications of
Floyd-Warshall, when compared to the original algorithm (which is always at 100%, not shown), for the input
of a graph with 1024 nodes and various arc densities. The right plot shows the difference in execution time,
compared to the original algorithm.
6 Single-tree 21 Single-tree
Hourglass Hourglass
5 20
% of combinations 19
% of running time
4
18
3
17
2 16
1 20 30 40 50 60 70 80 15 20 30 40 50 60 70 80
10 graph density (100% = n2 arcs) 10 graph density (100% = n2 arcs)
StuCoSReC Proceedings of the 2015 2nd Student Computer Science Research Conference 37
Ljubljana, Slovenia, 6 October