Page 49 - Fister jr., Iztok, and Andrej Brodnik (eds.). StuCoSReC. Proceedings of the 2015 2nd Student Computer Science Research Conference. Koper: University of Primorska Press, 2015
P. 49
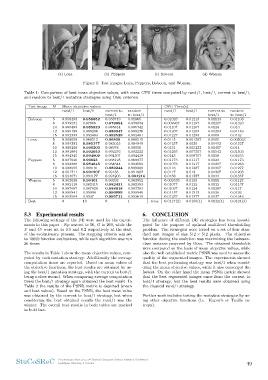
(a) Lena (b) PEppers (c) Baboon (d) Woman
Figure 1: Test images Lena, Peppers, Baboon, and Woman.
Table 1: Comparison of best mean objective values, with mean CPU times computed by rand/1, best/1, current to best/1,
and random to best/1 mutation strategies using Otsu criterion.
Test image M Mean objective values CPU Time(s)
rand/1 best/1 current to random rand/1 best/1 current to random
best/1 to best/1 best/1 to best/1
Baboon 5 0.958493 0.958852 0.958749 0.95865 0.01023 0.01213 0.01143 0.01103
8 0.979531 0.97988 0.979964 0.979874 0.009967 0.01197 0.01207 0.01323
10 0.985483 0.985823 0.985814 0.985742 0.01107 0.01267 0.0124 0.013
12 0.989188 0.989286 0.989347 0.989276 0.01267 0.01263 0.01283 0.01183
15 0.992333 0.992483 0.992529 0.992401 0.01227 0.01283 0.0168 0.0132
Lena 5 0.968098 0.968212 0.96839 0.968315 0.0115 0.001267 0.0105 0.005033
8 0.984382 0.985277 0.985055 0.984949 0.01257 0.0039 0.01413 0.01327
10 0.989208 0.990203 0.98978 0.98956 0.0131 0.005233 0.01417 0.014
12 0.991884 0.992653 0.992276 0.992222 0.01293 0.007367 0.01543 0.01503
15 0.994345 0.994909 0.994507 0.994439 0.0145 0.008767 0.0158 0.01633
Peppers 5 0.967926 0.96823 0.968125 0.968077 0.01173 0.01117 0.0123 0.01173
0.01073 0.01217 0.01207 0.01263
8 0.984386 0.984845 0.984844 0.984592 0.0116 0.01287 0.01317 0.01277
0.0117 0.013 0.01307 0.01203
10 0.988955 0.989191 0.989244 0.989009
12 0.991711 0.991907 0.99185 0.991807
15 0.994071 0.994177 0.994206 0.994216 0.0138 0.01337 0.0144 0.01357
Woman 5 0.963698 0.96401 0.96393 0.963852 0.009533 0.0109 0.0111 0.01127
0.01077 0.0122 0.0132 0.01137
8 0.982118 0.982415 0.982431 0.982393
10 0.987687 0.987929 0.988018 0.987783 0.01097 0.0124 0.01287 0.0117
12 0.990841 0.99098 0.990999 0.990945 0.01157 0.01313 0.0126 0.0126
15 0.993554 0.9937 0.993711 0.993619 0.01237 0.01377 0.0137 0.01343
Best 0 10 9 1 time 0.0117(2) 0.0106(1) 0.0132(4) 0.0124(3)
5.3 Experimental results 6. CONCLUSION
The following settings of the DE were used for the experi- The influence of different DE strategies has been investi-
ments in this paper : N p was set to 50, G to 200, while the gated for the purpose of optimal multilevel thresholding
F and Cr were set to 0.9 and 0.2 respectively at the start problem. The strategies were tested on a set of four stan-
of the evolutionary process. The stopping criteria was set dard test images of size 512 × 512 pixels. The objective
to 10000 function evaluations, while each algorithm was run function during the evolution was maximizing the between-
30 times. class variance proposed by Otsu. The obtained thresholds
were compared on the basis of mean objective values, while
The results in Table 1 show the mean objective values, com- also the well established metric PSNR was used to assess the
puted by each mutation strategy. Additionally the average quality of the segmented images. The experiments showed
computation times are reported. Based on mean values of that the best performing strategy was best/1 when consid-
the objective functions, the best results are obtained by us- ering the mean objective values, while it also converged the
ing the best/1 mutation strategy, with the current to best/1 fastest. On the other hand the mean PSNR metric showed
being a close second. When comparing average computation that the best segmented images came from the current to
times the best/1 strategy again obtained the best result. In best/1 strategy, but the best results were obtained using
Table 2 the results of the PSNR metric is depicted (mean the classical rand/1 strategy.
and best values). Based on the PSNR, the best mean value
was obtained by the current to best/1 strategy, but when Further work includes testing the mutation strategies by us-
considering the best obtained results the rand/1 was the ing other objective functions (i.e. Kapur’s or Tsallis en-
winner. The overall best results in both tables are marked tropy).
in bold face.
StuCoSReC Proceedings of the 2015 2nd Student Computer Science Research Conference 49
Ljubljana, Slovenia, 6 October