Page 58 - Fister jr., Iztok, and Andrej Brodnik (eds.). StuCoSReC. Proceedings of the 2015 2nd Student Computer Science Research Conference. Koper: University of Primorska Press, 2015
P. 58
ditional Model-View-Controller(MVC). Instead a Model- 3.2 Server side
Controller-Controler-View (MCCV) approach is used like il-
lustrated in Figure 1. The server side is implemented in PHP, and features dirty
checking of input data for security, logging capabilities and
Figure 1: Architecture model data transformation. The server must compute all of the sta-
tistical indicators on the entire database, but also supports
3.1 Client side arbitrary subsets defined by the user. Due to the dynami-
cally defined data the previously computed values can not
The client side was built with AngularJS that provided an be cached and must therefore be computed every time.
entirely new paradigm in web application development. The
main feature of the client side is to offer a user a simple tool The server also handles dataset uploads by first checking the
of constructing queries for viewing parts of the database or uploaded dataset for consistency, security, and validity of the
dataset. A query is constructed using an arbitrary number format. After the checking is done the dataset is parsed and
of relations between attributes. The query construction is inserted into the database.
all done client side. On query execution the constructed
query is sent to the server-side that examines examines the 4. STATISTICAL INDICATORS
code for possible SQL injections before translating it into
an SQL statement. Communication between the server side In population genetics, statistical indicators are commonly
and the client side is done with the help of Representational used to gain insight into a population’s biology and history
State Transfer (REST) interface. Exploring the data is very [14] . To obtain these indicators, researchers usually use a
simple trough the powerful filters that use fuzzy searching to variety of tools and programs [12] that are usually command
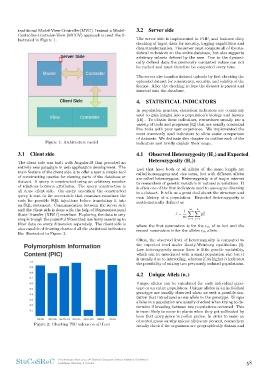
filter data on every dimension separately. The client side is line tools with poor user experience. We implemented the
also capable of drawing charts of all the statistical indicators most commonly used indicators to allow easier comparison
like illustrated in Figure 2. of datasets. We dedicate this chapter to outline each of the
indicators and briefly explain their usage.
Figure 2: Charting PIC values on all Loci
4.1 Observed Heterozygosity (Ho) and Expected
Heterozygosity (He))
Loci that have both or all alleles of the same length are
called homozygous and vice versa, loci with different alleles
are called heterozygous. Heterozygosity is of major interest
to researchers of genetic variation in natural populations. It
is often one of the first indicators used to asses gene diversity
in a dataset. It tells us a great deal about the structure and
even history of a population. Expected heterozygosity is
mathematically defined as
1 m k
m
1 − pi2
i=1 j=1
where the first summation is for the ith of m loci and the
second summation is for the alleles ith allele.
Often, the observed level of heterozygosity is compared to
the expected level under Hardy-Weinberg equilibrium [4].
Low heterozygosity means there is little genetic variability,
which can be associated with a small population size but it
is usually due to inbreeding, whereas if its higher it indicates
the possibility of mixing two previously isolated populations.
4.2 Unique Allels (nu)
Unique alleles can be calculated for each individual geno-
type or an entire population. Unique alleles in an individual
genotype are usually observed when we seek a possible mu-
tation that introduced a new allele in the genotype. Unique
alleles in a population are usually checked when trying to de-
termine if breeding between two populations occurred. This
is more likely to occur in plants when they get pollinated by
bees that carry genes in pollen grains. In order to make an
educated guess on why unique alleles are present, researchers
usually check if the organisms are geographically distant and
StuCoSReC Proceedings of the 2015 2nd Student Computer Science Research Conference 58
Ljubljana, Slovenia, 6 October
Controller-Controler-View (MCCV) approach is used like il-
lustrated in Figure 1. The server side is implemented in PHP, and features dirty
checking of input data for security, logging capabilities and
Figure 1: Architecture model data transformation. The server must compute all of the sta-
tistical indicators on the entire database, but also supports
3.1 Client side arbitrary subsets defined by the user. Due to the dynami-
cally defined data the previously computed values can not
The client side was built with AngularJS that provided an be cached and must therefore be computed every time.
entirely new paradigm in web application development. The
main feature of the client side is to offer a user a simple tool The server also handles dataset uploads by first checking the
of constructing queries for viewing parts of the database or uploaded dataset for consistency, security, and validity of the
dataset. A query is constructed using an arbitrary number format. After the checking is done the dataset is parsed and
of relations between attributes. The query construction is inserted into the database.
all done client side. On query execution the constructed
query is sent to the server-side that examines examines the 4. STATISTICAL INDICATORS
code for possible SQL injections before translating it into
an SQL statement. Communication between the server side In population genetics, statistical indicators are commonly
and the client side is done with the help of Representational used to gain insight into a population’s biology and history
State Transfer (REST) interface. Exploring the data is very [14] . To obtain these indicators, researchers usually use a
simple trough the powerful filters that use fuzzy searching to variety of tools and programs [12] that are usually command
filter data on every dimension separately. The client side is line tools with poor user experience. We implemented the
also capable of drawing charts of all the statistical indicators most commonly used indicators to allow easier comparison
like illustrated in Figure 2. of datasets. We dedicate this chapter to outline each of the
indicators and briefly explain their usage.
Figure 2: Charting PIC values on all Loci
4.1 Observed Heterozygosity (Ho) and Expected
Heterozygosity (He))
Loci that have both or all alleles of the same length are
called homozygous and vice versa, loci with different alleles
are called heterozygous. Heterozygosity is of major interest
to researchers of genetic variation in natural populations. It
is often one of the first indicators used to asses gene diversity
in a dataset. It tells us a great deal about the structure and
even history of a population. Expected heterozygosity is
mathematically defined as
1 m k
m
1 − pi2
i=1 j=1
where the first summation is for the ith of m loci and the
second summation is for the alleles ith allele.
Often, the observed level of heterozygosity is compared to
the expected level under Hardy-Weinberg equilibrium [4].
Low heterozygosity means there is little genetic variability,
which can be associated with a small population size but it
is usually due to inbreeding, whereas if its higher it indicates
the possibility of mixing two previously isolated populations.
4.2 Unique Allels (nu)
Unique alleles can be calculated for each individual geno-
type or an entire population. Unique alleles in an individual
genotype are usually observed when we seek a possible mu-
tation that introduced a new allele in the genotype. Unique
alleles in a population are usually checked when trying to de-
termine if breeding between two populations occurred. This
is more likely to occur in plants when they get pollinated by
bees that carry genes in pollen grains. In order to make an
educated guess on why unique alleles are present, researchers
usually check if the organisms are geographically distant and
StuCoSReC Proceedings of the 2015 2nd Student Computer Science Research Conference 58
Ljubljana, Slovenia, 6 October