Page 201 - Hojnik, Jana. 2017. In Persuit of Eco-innovation. Drivers and Consequences of Eco-innovation at Firm Level. Koper: University of Primorska Press
P. 201
Results 201
Note pertaining to Figure 16: Measurement items: Q8B = The company is improving and de-
signing environmentally friendly packaging (e.g., using less paper and plastic materials) for exi-
sting and new products; Q8E = The company chooses materials of the product that consu-
me the least amount of energy and resources for conducting the product development or de-
sign; Q8F = The company uses the smallest amount of materials to comprise the product for
conducting the product development or design; Q8G = The company deliberately evaluates
whether the product is easy to recycle, reuse and decompose for conducting the product de-
velopment or design; Q9A = Low energy consumption such as water, electricity, gas, and pe-
trol during production/use/disposal; Q9B = Recycle, reuse, and remanufacture material; Q9G
= Use of cleaner technology to generate savings and prevent pollution (such as energy, water,
and waste); Q9H = The manufacturing process of the company effectively reduces the emissi-
on of hazardous substances or waste; Q9I = The manufacturing process of the company re-
duces the use of raw materials; Q10A = Our firm management often uses novel systems to
manage eco-innovation; Q10B = Our firm management often collects information on eco-
-innovation trends; Q10C = Our firm management often actively engages in eco-innovation
activities; Q10D = Our firm management often communicates eco-innovation information
with employees; Q10E = Our firm management often invests a high ratio of R&D in eco-inno-
vation; Q10F = Our firm management often communicates experiences among various de-
partments involved in eco-innovation; Chi-square = 228.463; p = 0.00; Goodness-of-fit indexes:
NFI = 0.928; NNFI = 0.945; CFI = 0.954; SRMR = 0.044; RMSEA = 0.086; Reliability coeffici-
ents: Cronbach’s alpha = 0.952; RHO = 0.968.
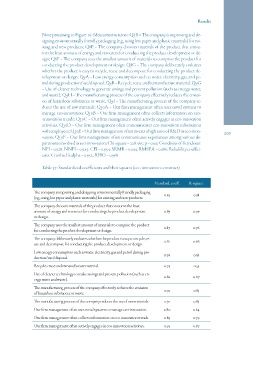
Table 57: Standardized coefficients and their squares (eco-innovation construct)
Standard. coeff. R-square
0.38
The company is improving and designing environmentally friendly packaging 0.62
(e.g., using less paper and plastic materials) for existing and new products. 0.79
The company chooses materials of the product that consume the least 0.89 0.76
amount of energy and resources for conducting the product development
or design. 0.66
The company uses the smallest amount of materials to comprise the product 0.87 0.58
for conducting the product development or design. 0.53
0.67
The company deliberately evaluates whether the product is easy to recycle, re- 0.81
use and decompose for conducting the product development or design. 0.83
0.83
Low energy consumption such as water, electricity, gas and petrol during pro- 0.76 0.64
duction/use/disposal. 0.79
0.87
Recycle, reuse and remanufacture material. 0.73
Use of cleaner technology to make savings and prevent pollution (such as en- 0.82
ergy, water and waste).
The manufacturing process of the company effectively reduces the emission 0.91
of hazardous substances or waste.
The manufacturing process of the company reduces the use of raw materials. 0.91
Our firm management often uses novel systems to manage eco-innovation. 0.80
Our firm management often collects information on eco-innovation trends. 0.89
Our firm management often actively engages in eco-innovation activities. 0.93
Note pertaining to Figure 16: Measurement items: Q8B = The company is improving and de-
signing environmentally friendly packaging (e.g., using less paper and plastic materials) for exi-
sting and new products; Q8E = The company chooses materials of the product that consu-
me the least amount of energy and resources for conducting the product development or de-
sign; Q8F = The company uses the smallest amount of materials to comprise the product for
conducting the product development or design; Q8G = The company deliberately evaluates
whether the product is easy to recycle, reuse and decompose for conducting the product de-
velopment or design; Q9A = Low energy consumption such as water, electricity, gas, and pe-
trol during production/use/disposal; Q9B = Recycle, reuse, and remanufacture material; Q9G
= Use of cleaner technology to generate savings and prevent pollution (such as energy, water,
and waste); Q9H = The manufacturing process of the company effectively reduces the emissi-
on of hazardous substances or waste; Q9I = The manufacturing process of the company re-
duces the use of raw materials; Q10A = Our firm management often uses novel systems to
manage eco-innovation; Q10B = Our firm management often collects information on eco-
-innovation trends; Q10C = Our firm management often actively engages in eco-innovation
activities; Q10D = Our firm management often communicates eco-innovation information
with employees; Q10E = Our firm management often invests a high ratio of R&D in eco-inno-
vation; Q10F = Our firm management often communicates experiences among various de-
partments involved in eco-innovation; Chi-square = 228.463; p = 0.00; Goodness-of-fit indexes:
NFI = 0.928; NNFI = 0.945; CFI = 0.954; SRMR = 0.044; RMSEA = 0.086; Reliability coeffici-
ents: Cronbach’s alpha = 0.952; RHO = 0.968.
Table 57: Standardized coefficients and their squares (eco-innovation construct)
Standard. coeff. R-square
0.38
The company is improving and designing environmentally friendly packaging 0.62
(e.g., using less paper and plastic materials) for existing and new products. 0.79
The company chooses materials of the product that consume the least 0.89 0.76
amount of energy and resources for conducting the product development
or design. 0.66
The company uses the smallest amount of materials to comprise the product 0.87 0.58
for conducting the product development or design. 0.53
0.67
The company deliberately evaluates whether the product is easy to recycle, re- 0.81
use and decompose for conducting the product development or design. 0.83
0.83
Low energy consumption such as water, electricity, gas and petrol during pro- 0.76 0.64
duction/use/disposal. 0.79
0.87
Recycle, reuse and remanufacture material. 0.73
Use of cleaner technology to make savings and prevent pollution (such as en- 0.82
ergy, water and waste).
The manufacturing process of the company effectively reduces the emission 0.91
of hazardous substances or waste.
The manufacturing process of the company reduces the use of raw materials. 0.91
Our firm management often uses novel systems to manage eco-innovation. 0.80
Our firm management often collects information on eco-innovation trends. 0.89
Our firm management often actively engages in eco-innovation activities. 0.93