Page 87 - Koderman, Miha, and Vuk Tvrtko Opačić. Eds. 2020. Challenges of tourism development in protected areas of Croatia and Slovenia. Koper, Zagreb: University of Primorska Press, Croatian Geographical Society
P. 87
tourism in protected areas and the transformation of mljet island, croatia
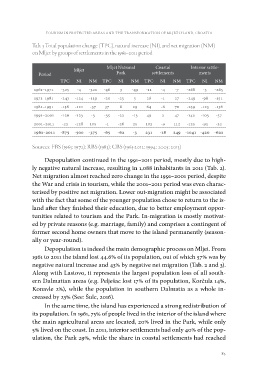
Tab. 3 Total population change (TPC), natural increase (NI), and net migration (NM)
on Mljet by groups of settlements in the 1961–2011 period
Period Mljet Mljet National Coastal Interior settle-
1961–1971 Park settlements ments
TPC NI NM TPC NI NM TPC NI NM TPC NI NM
-325 -4 -321 -46 3 -49 -11 -4 -7 -268 -3 -265
1971–1981 -243 -124 -119 -20 -25 5 26 -1 27 -249 -98 -151
1981–1991 -158 -121 -37 37 8 29 64 -6 70 -259 -123 -136
1991–2001 -126 -123 -3 -35 -22 -13 49 2 47 -140 -103 -37
2001–2011 -23 -128 105 -1 -26 25 103 -9 112 -125 -93 -32
1961–2011 -875 -500 -375 -65 -62 -3 231 -18 249 -1041 -420 -621
Sources: FBS (1965; 1972); RBS (1983); CBS (1965-2012; 1994; 2003; 2013)
Depopulation continued in the 1991–2011 period, mostly due to high-
ly negative natural increase, resulting in 1,088 inhabitants in 2011 (Tab. 2).
Net migration almost reached zero change in the 1991–2001 period, despite
the War and crisis in tourism, while the 2001–2011 period was even charac-
terised by positive net migration. Lower out-migration might be associated
with the fact that some of the younger population chose to return to the is-
land after they finished their education, due to better employment oppor-
tunities related to tourism and the Park. In-migration is mostly motivat-
ed by private reasons (e.g. marriage, family) and comprises a contingent of
former second home owners that move to the island permanently (season-
ally or year-round).
Depopulation is indeed the main demographic process on Mljet. From
1961 to 2011 the island lost 44.6% of its population, out of which 57% was by
negative natural increase and 43% by negative net migration (Tab. 2 and 3).
Along with Lastovo, it represents the largest population loss of all south-
ern Dalmatian areas (e.g. Pelješac lost 17% of its population, Korčula 14%,
Konavle 2%), while the population in southern Dalmatia as a whole in-
creased by 23% (See: Šulc, 2016).
In the same time, the island has experienced a strong redistribution of
its population. In 1961, 75% of people lived in the interior of the island where
the main agricultural areas are located, 20% lived in the Park, while only
5% lived on the coast. In 2011, interior settlements had only 40% of the pop-
ulation, the Park 29%, while the share in coastal settlements had reached
85