Page 41 - Fister jr., Iztok, Andrej Brodnik, Matjaž Krnc and Iztok Fister (eds.). StuCoSReC. Proceedings of the 2019 6th Student Computer Science Research Conference. Koper: University of Primorska Press, 2019
P. 41
le 7: Detected significant statistical differences 6
with the Wilcoxon test with qα = 0.05 on BCW
dataset 5
KM PSO CLPSO OVCPSO MPSO CPSO MCUPSO 4 Mean rank
KM ∞+ + + ++ + 3
PSO /∞ + + ∼∼ + KM PSO CLPSOAOlgVoCrPitShOmMPSO CPSO MCUPSO
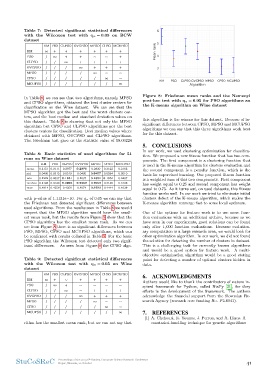
CLPSO / / ∞ + ++ + Figure 8: Friedman mean ranks and the Nemenyi
post-hoc test with qα = 0.05 for PSO algorithms an
OVCPSO / / / ∞ ++ + the K-means algorithm on Wine dataset
MPSO // / / ∞∼ ∼ this algorithm is the winner for this dataset. Because of in-
significant differences between CPSO, MPSO and MCUPSO
CPSO // / / /∞ ∼ algorithms we can say that this three algorithms work best
for for this dataset.
MCUPSO / / / / // ∞
5. CONCLUSIONS
In Table 8, we can see that two algorithms, namely MPSO
and CPSO algorithms, obtained the best cluster centers for In our work, we used clustering optimization for classifica-
classification on the Wine dataset. We can see that the tion. We proposed a new fitness function that has two com-
MPSO algorithm got the best and the worst clusters cen- ponents. The first component is a clustering function that
ters, and the best median and standard deviation values on is used in the K-means algorithm for clusters evaluation and
this dataset. Table 8 is showing that not only the MPSO the second component is a penalty function, which is the
algorithm but CPSO and CLPSO algorithms got the best basis for supervised learning. Our proposed fitness function
clusters centers for classification. Best median values where is a weighted sum of this two components. First component
obtained with MPSO, OVCPSO and CLPSO algorithms. has weight equal to 0.25 and second component has weight
The Friedman test gave us the statistic value of 58.06224 equal to 0.75. As it turns out, on used datasets, this fitness
function works well. In our work we tried to eliminate initial
Table 8: Basic statistics of used algorithms for 51 clusters defect of the K-means algorithm, which makes the
runs on Wine dataset K-means algorithm converge fast to some local optimum.
KM PSO CLPSO OVCPSO MPSO CPSO MCUPSO One of the options for feature work is to use more func-
tion evaluations with an additional archive, because as we
mean 0.3151 0.3111 0.2977 0.2970 0.2930 0.3122 0.3162 have seen in our experiments, good solutions can be found
only after 1, 000 function evaluations. Because evolution-
std 0.0490 0.0515 0.0519 0.0495 0.0457 0.0594 0.0510 ary computation is a large research area, we would look for
other optimization algorithm. In our work, we did not found
min 0.2222 0.2037 0.1851 0.2037 0.1851 0.1851 0.2407 the solution for detecting the number of clusters in dataset.
This is a challenging task for currently known algorithms
median 0.3148 0.3148 0.2962 0.2962 0.2962 0.3148 0.3148 and would be a good option for feature work. A multi-
objective optimization algorithm would be a good stating
max 0.4814 0.4259 0.4259 0.4074 0.3703 0.4444 0.4629 point for detecting a number of optimal clusters hidden in
data.
with p-value of 1.1131e−10. For qα of 0.05 we can say that
the Friedman test detected significant differences between 6. ACKNOWLEDGMENTS
used algorithms. From the results seen in Table 8 we would
suspect that the MPSO algorithm would have the small- Authors would like to thank the contributors of nature in-
est mean rank, but the results from Figure 8 show that the spired framework for Python, called NiaPy [21], for they
CPSO algorithm has the smallest mean rank. As we can efforts in the development of the framework. The authors
see from Figure 8 there is no significant differences between acknowledge the financial support from the Slovenian Re-
PSO, MPSO, CPSO and MCUPSO algorithms, which can search Agency (research core funding No. P2-0041).
be confirmed with results collated in Table 9. For the basic
PSO algorithm the Wilcoxon test detected only two signif- 7. REFERENCES
icant differences. As seen from Figure 8 the CPSO algo-
[1] A. Chehouri, R. Younes, J. Perron, and A. Ilinca. A
Table 9: Detected significant statistical differences constraint-handling technique for genetic algorithms
with the Wilcoxon test with qα = 0.05 on Wine
dataset
KM PSO CLPSO OVCPSO MPSO CPSO MCUPSO
KM ∞+ ∼ + ++ +
PSO /∞ + ∼ ∼∼ ∼
CLPSO / / ∞ ∼ ++ +
OVCPSO / / / ∞ ++ +
MPSO // / / ∞∼ ∼
CPSO // / / /∞ ∼
MCUPSO / / / / // ∞
rithm has the smallest mean rank, but we can not say that
StuCoSReC Proceedings of the 2019 6th Student Computer Science Research Conference 41
Koper, Slovenia, 10 October
with the Wilcoxon test with qα = 0.05 on BCW
dataset 5
KM PSO CLPSO OVCPSO MPSO CPSO MCUPSO 4 Mean rank
KM ∞+ + + ++ + 3
PSO /∞ + + ∼∼ + KM PSO CLPSOAOlgVoCrPitShOmMPSO CPSO MCUPSO
CLPSO / / ∞ + ++ + Figure 8: Friedman mean ranks and the Nemenyi
post-hoc test with qα = 0.05 for PSO algorithms an
OVCPSO / / / ∞ ++ + the K-means algorithm on Wine dataset
MPSO // / / ∞∼ ∼ this algorithm is the winner for this dataset. Because of in-
significant differences between CPSO, MPSO and MCUPSO
CPSO // / / /∞ ∼ algorithms we can say that this three algorithms work best
for for this dataset.
MCUPSO / / / / // ∞
5. CONCLUSIONS
In Table 8, we can see that two algorithms, namely MPSO
and CPSO algorithms, obtained the best cluster centers for In our work, we used clustering optimization for classifica-
classification on the Wine dataset. We can see that the tion. We proposed a new fitness function that has two com-
MPSO algorithm got the best and the worst clusters cen- ponents. The first component is a clustering function that
ters, and the best median and standard deviation values on is used in the K-means algorithm for clusters evaluation and
this dataset. Table 8 is showing that not only the MPSO the second component is a penalty function, which is the
algorithm but CPSO and CLPSO algorithms got the best basis for supervised learning. Our proposed fitness function
clusters centers for classification. Best median values where is a weighted sum of this two components. First component
obtained with MPSO, OVCPSO and CLPSO algorithms. has weight equal to 0.25 and second component has weight
The Friedman test gave us the statistic value of 58.06224 equal to 0.75. As it turns out, on used datasets, this fitness
function works well. In our work we tried to eliminate initial
Table 8: Basic statistics of used algorithms for 51 clusters defect of the K-means algorithm, which makes the
runs on Wine dataset K-means algorithm converge fast to some local optimum.
KM PSO CLPSO OVCPSO MPSO CPSO MCUPSO One of the options for feature work is to use more func-
tion evaluations with an additional archive, because as we
mean 0.3151 0.3111 0.2977 0.2970 0.2930 0.3122 0.3162 have seen in our experiments, good solutions can be found
only after 1, 000 function evaluations. Because evolution-
std 0.0490 0.0515 0.0519 0.0495 0.0457 0.0594 0.0510 ary computation is a large research area, we would look for
other optimization algorithm. In our work, we did not found
min 0.2222 0.2037 0.1851 0.2037 0.1851 0.1851 0.2407 the solution for detecting the number of clusters in dataset.
This is a challenging task for currently known algorithms
median 0.3148 0.3148 0.2962 0.2962 0.2962 0.3148 0.3148 and would be a good option for feature work. A multi-
objective optimization algorithm would be a good stating
max 0.4814 0.4259 0.4259 0.4074 0.3703 0.4444 0.4629 point for detecting a number of optimal clusters hidden in
data.
with p-value of 1.1131e−10. For qα of 0.05 we can say that
the Friedman test detected significant differences between 6. ACKNOWLEDGMENTS
used algorithms. From the results seen in Table 8 we would
suspect that the MPSO algorithm would have the small- Authors would like to thank the contributors of nature in-
est mean rank, but the results from Figure 8 show that the spired framework for Python, called NiaPy [21], for they
CPSO algorithm has the smallest mean rank. As we can efforts in the development of the framework. The authors
see from Figure 8 there is no significant differences between acknowledge the financial support from the Slovenian Re-
PSO, MPSO, CPSO and MCUPSO algorithms, which can search Agency (research core funding No. P2-0041).
be confirmed with results collated in Table 9. For the basic
PSO algorithm the Wilcoxon test detected only two signif- 7. REFERENCES
icant differences. As seen from Figure 8 the CPSO algo-
[1] A. Chehouri, R. Younes, J. Perron, and A. Ilinca. A
Table 9: Detected significant statistical differences constraint-handling technique for genetic algorithms
with the Wilcoxon test with qα = 0.05 on Wine
dataset
KM PSO CLPSO OVCPSO MPSO CPSO MCUPSO
KM ∞+ ∼ + ++ +
PSO /∞ + ∼ ∼∼ ∼
CLPSO / / ∞ ∼ ++ +
OVCPSO / / / ∞ ++ +
MPSO // / / ∞∼ ∼
CPSO // / / /∞ ∼
MCUPSO / / / / // ∞
rithm has the smallest mean rank, but we can not say that
StuCoSReC Proceedings of the 2019 6th Student Computer Science Research Conference 41
Koper, Slovenia, 10 October