Page 38 - Fister jr., Iztok, Andrej Brodnik, Matjaž Krnc and Iztok Fister (eds.). StuCoSReC. Proceedings of the 2019 6th Student Computer Science Research Conference. Koper: University of Primorska Press, 2019
P. 38
t a solution can get is equal to: distances determining, that the results of two algorithms are
significantly different, when their critical distance intervals
A−1 uj − lj , (10) do not overlap. To be really confident that the difference be-
K tween the results is significant, we ran a Wilcoxon 2-paired
signed-rank test [22]. We present the result of Wilcoxon test
i=0 in tables, where character ”+” denotes that the results of two
algorithms are statistically significantly different, while the
where the search space is divided into K partitions and every character ”∼” shows that the difference between the results
cluster should be in partition occupied only by one cluster. is not statistically significant. For better accuracy of sta-
tistical testing, we used 51 runs. To get a better accuracy
In our paper, we introduce the penalty function 2 for clus- of Friedman tests, we used more then five classifiers in our
tering, defined as: second experiment as a rule described in [2].
p (Z, O, c) = 1 − a (Z, O, c) × u − l 2 × 2, (11) For comparing the results of our two experiments we used
error rate calculated as:
where u represents upper limits of the search space, l repre-
sents lower limits of the search space, c represents a vector e (Z, O, c) = 1 − a (Z, O, c) , (12)
of class or class labels of an instances in dataset O, and a is N
a function for calculating the accuracy of a given centers Z.
In Eq. (11) we added multiplication factor of two, because where O is a dataset, Z represents centers of clusters, N
we want to give this penalty a higher weight. Eq. (11) rede- represents number of instances in a dataset O, c hold the
fines the problem from unsupervised to supervised learning labels that represent classes for each instance in a dataset
method, because we added the information of how the in- O and a is the function that returns the number of cor-
stance is classified to the learning method. rectly classified instances of the dataset O based on centers
Z. Before the experiment runs we divided the dataset into
4. EXPERIMENTS AND RESULTS training and validation sets, where the validation set con-
tained 30% of samples of the original dataset. The error
In our work, we performed two separate experiments. The rates that we compared where taken from the validation set
after the optimization process finished. Because of using the
first experiment, compares the fitness functions for classifi- error rate for statistical analysis with a combination of the
Friedman test ranks, we can say that the best algorithm has
cation based on clustering. The second experiment, presents the smallest mean rank.
statistical comparison of used PSO algorithms for classifica-
tion based on clustering with the best fitness function from
our first experiment. Python code of implemented algo-
rithms can be accessed at GitHub 1 and Python code of
experiments can be accessed at GitHub 2.
In our experiments we had to adjust the representation of 4.1 Fitness function comparison
the individual so that all operators of PSO algorithms could
work properly. Figure 3 shows an example of an individual The first experiment that we conducted was for testing per-
in a population, where z1, · · · , zk represents clusters. Cen- formance of the fitness functions used for classification. In
ters have K components which represent center points for this test, we used four different fitness functions described
each attribute of the dataset. Figure 3 shows attributes in Section 3 with the standard PSO algorithm [10] and the
centers in form of symbols z1,1, · · · , z1,n for cluster one and K-means algorithm. The K-means algorithm was initialized
zk,1, · · · , zk,n for cluster k. For all PSO algorithms used in with random centers of clusters. For the experiment we gen-
erated a random dataset with four different classes and 500
samples that had nine components or so called attributes.
For dataset generation we used scikt-learn’s [15] function
make_blobs. In the generated dataset each class had 125 in-
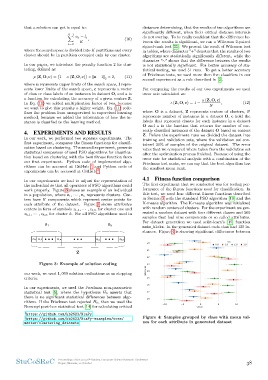
stances. Figure 4 is showing significant differences between
Figure 3: Example of solution coding attribute a0 0.0 1.0Class 2.0 3.0
a1 5 valu0e 5 10
our work, we used 1, 000 solution evaluations as an stopping a2
criteria. a3
a4
In our experiments, we used the Friedman non-parametric a5
statistical test [5], where the hypothesis H0 asserts that a6
there is no significant statistical differences between algo- a7
rithms. If the Friedman test rejected H0, then we used the a8
Nemenyi post-hoc statistical test [14] for calculating critical
10
1https://github.com/kb2623/NiaPy
2https://github.com/kb2623/NiaPy-examples/tree/ Figure 4: Samples grouped by class with mean val-
master/clustering_datasets ues for each attribute in generated dataset
StuCoSReC Proceedings of the 2019 6th Student Computer Science Research Conference 38
Koper, Slovenia, 10 October
significantly different, when their critical distance intervals
A−1 uj − lj , (10) do not overlap. To be really confident that the difference be-
K tween the results is significant, we ran a Wilcoxon 2-paired
signed-rank test [22]. We present the result of Wilcoxon test
i=0 in tables, where character ”+” denotes that the results of two
algorithms are statistically significantly different, while the
where the search space is divided into K partitions and every character ”∼” shows that the difference between the results
cluster should be in partition occupied only by one cluster. is not statistically significant. For better accuracy of sta-
tistical testing, we used 51 runs. To get a better accuracy
In our paper, we introduce the penalty function 2 for clus- of Friedman tests, we used more then five classifiers in our
tering, defined as: second experiment as a rule described in [2].
p (Z, O, c) = 1 − a (Z, O, c) × u − l 2 × 2, (11) For comparing the results of our two experiments we used
error rate calculated as:
where u represents upper limits of the search space, l repre-
sents lower limits of the search space, c represents a vector e (Z, O, c) = 1 − a (Z, O, c) , (12)
of class or class labels of an instances in dataset O, and a is N
a function for calculating the accuracy of a given centers Z.
In Eq. (11) we added multiplication factor of two, because where O is a dataset, Z represents centers of clusters, N
we want to give this penalty a higher weight. Eq. (11) rede- represents number of instances in a dataset O, c hold the
fines the problem from unsupervised to supervised learning labels that represent classes for each instance in a dataset
method, because we added the information of how the in- O and a is the function that returns the number of cor-
stance is classified to the learning method. rectly classified instances of the dataset O based on centers
Z. Before the experiment runs we divided the dataset into
4. EXPERIMENTS AND RESULTS training and validation sets, where the validation set con-
tained 30% of samples of the original dataset. The error
In our work, we performed two separate experiments. The rates that we compared where taken from the validation set
after the optimization process finished. Because of using the
first experiment, compares the fitness functions for classifi- error rate for statistical analysis with a combination of the
Friedman test ranks, we can say that the best algorithm has
cation based on clustering. The second experiment, presents the smallest mean rank.
statistical comparison of used PSO algorithms for classifica-
tion based on clustering with the best fitness function from
our first experiment. Python code of implemented algo-
rithms can be accessed at GitHub 1 and Python code of
experiments can be accessed at GitHub 2.
In our experiments we had to adjust the representation of 4.1 Fitness function comparison
the individual so that all operators of PSO algorithms could
work properly. Figure 3 shows an example of an individual The first experiment that we conducted was for testing per-
in a population, where z1, · · · , zk represents clusters. Cen- formance of the fitness functions used for classification. In
ters have K components which represent center points for this test, we used four different fitness functions described
each attribute of the dataset. Figure 3 shows attributes in Section 3 with the standard PSO algorithm [10] and the
centers in form of symbols z1,1, · · · , z1,n for cluster one and K-means algorithm. The K-means algorithm was initialized
zk,1, · · · , zk,n for cluster k. For all PSO algorithms used in with random centers of clusters. For the experiment we gen-
erated a random dataset with four different classes and 500
samples that had nine components or so called attributes.
For dataset generation we used scikt-learn’s [15] function
make_blobs. In the generated dataset each class had 125 in-
stances. Figure 4 is showing significant differences between
Figure 3: Example of solution coding attribute a0 0.0 1.0Class 2.0 3.0
a1 5 valu0e 5 10
our work, we used 1, 000 solution evaluations as an stopping a2
criteria. a3
a4
In our experiments, we used the Friedman non-parametric a5
statistical test [5], where the hypothesis H0 asserts that a6
there is no significant statistical differences between algo- a7
rithms. If the Friedman test rejected H0, then we used the a8
Nemenyi post-hoc statistical test [14] for calculating critical
10
1https://github.com/kb2623/NiaPy
2https://github.com/kb2623/NiaPy-examples/tree/ Figure 4: Samples grouped by class with mean val-
master/clustering_datasets ues for each attribute in generated dataset
StuCoSReC Proceedings of the 2019 6th Student Computer Science Research Conference 38
Koper, Slovenia, 10 October