Page 74 - Fister jr., Iztok, Andrej Brodnik, Matjaž Krnc and Iztok Fister (eds.). StuCoSReC. Proceedings of the 2019 6th Student Computer Science Research Conference. Koper: University of Primorska Press, 2019
P. 74
e the condition can be written as Table 2: Computational result for the modified trig-
gering model with different number of seeds |S| and
Zi,0 ≥ Zj,R ∀j (11) run time R.
j∈V :d(i,j)≤R
which is equivalent to (7) changing the names of the vari- Rate |S| = 1, R = 4 |S| = 2, R = 3 |S| = 3, R = 2
ables. 0.3 Avg Dev Avg Dev Avg Dev
0.4 9.1 2.0 14.3 2.0 15.8 1.9
4.2 Computational comparison of the models 0.5 11.1 2.4 15.7 1.8 17.6 1.6
0.6 14.8 2.0 20.6 2.2 20.7 1.7
To compare the models we implemented them in AMPL, 0.7 16.6 2.2 24.4 2.5 24.8 2.0
a mathematical programming language. We use (1-3) to 0.8 17.9 1.7 26.7 2.2 26.1 1.6
define the triggering model and (4-6) for the maximum cov- 0.9 20.8 0.8 32.9 2.8 29.8 1.4
ering model. The problems were solved by the commercial 1.0 22.0 0.0 35.9 0.5 31.9 0.3
optimization solver CPLEX. 22.0 0.0 36.0 0.0 32.0 0.0
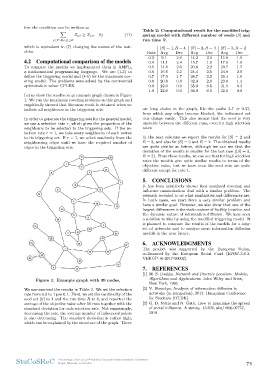
Let us show the results on an example graph drawn in Figure are long chains in the graph, like the paths 2-7 or 9-37,
1. We run the maximum covering problem on this graph and from which any edges become blocked, the influenced set
empirically showed that the same result is obtained when we can change easily. This also means that the seed is very
include all neighbours in the triggering sets. unstable between the different runs, even for high selection
rates.
In order to generate the triggering sets for the general model,
we use a selection rate r, which gives the proportion of the In the next columns we report the results for |S| = 2 and
neighbours to be selected to the triggering sets. If the se- R = 3, and also for |S| = 3 and R = 2. The obtained results
lection rate r = 1, we take every neighbours of each vertex are quite similar as before, although we can see that the
to its triggering set. If r < 1, we select randomly from the deviation of the results is smaller for the last case (|S| = 3,
neighbouring edges until we have the required number of R = 2). From these results, we can see that for high selection
edges in the triggering sets. rates the models give quite similar results in terms of the
objective value, but we have seen the seed sets are quite
Figure 1: Example graph with 39 nodes. different except for rate 1.
We summarized the results in Table 2. We set the selection 5. CONCLUSIONS
rate from 0.3 to 1 per 0.1. First, we set the cardinality of the
seed set |S| to 1 and the run time R to 4, and reported the It has been intuitively shown that maximal covering and
average of the objective value after 50 runs together with the influence maximization deal with a similar problem. The
standard deviation for each selection rate. Not surprisingly, research revealed to us what similarities and differences are.
decreasing the rate, the average number of influenced points In both cases, we start from a very similar problem and
is also decreasing. The standard deviation is rather high, have a similar goal. However, we also show that one of the
which can be explained by the structure of the graph. There largest differences is the static nature of facility location and
the dynamic nature of information diffusion. We have seen
a solution to this by using the modified triggering model. It
is planned to compare the results of the models for a large
set of networks and to analyze more information diffusion
models in the near future.
6. ACKNOWLEDGMENTS
The project was supported by the European Union,
co-financed by the European Social Fund (EFOP-3.6.3-
VEKOP-16-2017-00002).
7. REFERENCES
[1] M. S. Daskin. Network and Discrete Location: Models,
Algorithms and Applications. John Wiley and Sons,
New York, 1995.
[2] V. Homolya. Analysis of information diffusion in
networks (in hungarian), 2017. Hungarian Conference
for Students (OTDK).
[3] G. D. Nittis and N. Gatti. How to maximize the spread
of social influence: A survey. CoRR, abs/1806.07757,
2018.
StuCoSReC Proceedings of the 2019 6th Student Computer Science Research Conference 74
Koper, Slovenia, 10 October
gering model with different number of seeds |S| and
Zi,0 ≥ Zj,R ∀j (11) run time R.
j∈V :d(i,j)≤R
which is equivalent to (7) changing the names of the vari- Rate |S| = 1, R = 4 |S| = 2, R = 3 |S| = 3, R = 2
ables. 0.3 Avg Dev Avg Dev Avg Dev
0.4 9.1 2.0 14.3 2.0 15.8 1.9
4.2 Computational comparison of the models 0.5 11.1 2.4 15.7 1.8 17.6 1.6
0.6 14.8 2.0 20.6 2.2 20.7 1.7
To compare the models we implemented them in AMPL, 0.7 16.6 2.2 24.4 2.5 24.8 2.0
a mathematical programming language. We use (1-3) to 0.8 17.9 1.7 26.7 2.2 26.1 1.6
define the triggering model and (4-6) for the maximum cov- 0.9 20.8 0.8 32.9 2.8 29.8 1.4
ering model. The problems were solved by the commercial 1.0 22.0 0.0 35.9 0.5 31.9 0.3
optimization solver CPLEX. 22.0 0.0 36.0 0.0 32.0 0.0
Let us show the results on an example graph drawn in Figure are long chains in the graph, like the paths 2-7 or 9-37,
1. We run the maximum covering problem on this graph and from which any edges become blocked, the influenced set
empirically showed that the same result is obtained when we can change easily. This also means that the seed is very
include all neighbours in the triggering sets. unstable between the different runs, even for high selection
rates.
In order to generate the triggering sets for the general model,
we use a selection rate r, which gives the proportion of the In the next columns we report the results for |S| = 2 and
neighbours to be selected to the triggering sets. If the se- R = 3, and also for |S| = 3 and R = 2. The obtained results
lection rate r = 1, we take every neighbours of each vertex are quite similar as before, although we can see that the
to its triggering set. If r < 1, we select randomly from the deviation of the results is smaller for the last case (|S| = 3,
neighbouring edges until we have the required number of R = 2). From these results, we can see that for high selection
edges in the triggering sets. rates the models give quite similar results in terms of the
objective value, but we have seen the seed sets are quite
Figure 1: Example graph with 39 nodes. different except for rate 1.
We summarized the results in Table 2. We set the selection 5. CONCLUSIONS
rate from 0.3 to 1 per 0.1. First, we set the cardinality of the
seed set |S| to 1 and the run time R to 4, and reported the It has been intuitively shown that maximal covering and
average of the objective value after 50 runs together with the influence maximization deal with a similar problem. The
standard deviation for each selection rate. Not surprisingly, research revealed to us what similarities and differences are.
decreasing the rate, the average number of influenced points In both cases, we start from a very similar problem and
is also decreasing. The standard deviation is rather high, have a similar goal. However, we also show that one of the
which can be explained by the structure of the graph. There largest differences is the static nature of facility location and
the dynamic nature of information diffusion. We have seen
a solution to this by using the modified triggering model. It
is planned to compare the results of the models for a large
set of networks and to analyze more information diffusion
models in the near future.
6. ACKNOWLEDGMENTS
The project was supported by the European Union,
co-financed by the European Social Fund (EFOP-3.6.3-
VEKOP-16-2017-00002).
7. REFERENCES
[1] M. S. Daskin. Network and Discrete Location: Models,
Algorithms and Applications. John Wiley and Sons,
New York, 1995.
[2] V. Homolya. Analysis of information diffusion in
networks (in hungarian), 2017. Hungarian Conference
for Students (OTDK).
[3] G. D. Nittis and N. Gatti. How to maximize the spread
of social influence: A survey. CoRR, abs/1806.07757,
2018.
StuCoSReC Proceedings of the 2019 6th Student Computer Science Research Conference 74
Koper, Slovenia, 10 October