Page 77 - Fister jr., Iztok, Andrej Brodnik, Matjaž Krnc and Iztok Fister (eds.). StuCoSReC. Proceedings of the 2019 6th Student Computer Science Research Conference. Koper: University of Primorska Press, 2019
P. 77
256 256 256 3 7 95 405 22 2 25 0 1 19
104 70 43 102
32 64 128 256 + + +
preprocess 10 12 23 4 73 5 36 6
F1=0.76
1 1 6 4
concat Multi-domain
features Normal AF Other Noisy
32 ~ 2 concat 256 ~ 1 F1=0.79
32 ~ 4 256 ~ 1
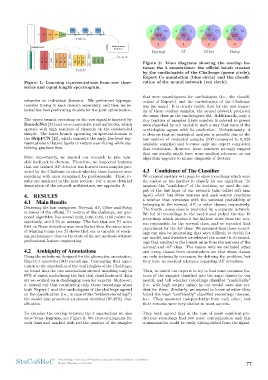
pool pool 256 ~ 1 Figure 2: Venn diagrams showing the overlap be-
64 ~ 1 tween the 3 annotations: the official labels created
64 ~ 2 by the cardiologists of the Challenge (green circle),
64 ~ 4 Expert-1’s annotation (blue circle) and the classifi-
cation of the neural network (red circle).
pool concat
128 ~ 1
128 ~ 2
128 ~ 4
F1=0.77
Figure 1: Learning representations from raw time-
series and equal length spectrogram.
networks on individual domains. We performed hyperpa- that were unambiguous for cardiologists (i.e., the classifi-
rameter tuning in each domain separately, and then we se- cation of Expert-1 and the cardiologists of the Challenge
lected the best performing models for the joint optimization. was the same). It is clearly visible that for the vast major-
ity of these evident samples, the neural network predicted
The upper branch operating on the raw signal is inspired by the same class as the cardiologists did. Additionally, only a
EncodeNet [24] and uses consecutive residual blocks, which tiny fraction of samples (their number is colored to green)
operate with high numbers of channels on the downscaled were classified by our model in such a way that none of the
sample. The lower branch operating on spectral-domain is cardiologists agrees with its prediction. Unfortunately, it
the SkipFCN [25], which connects the early low-level rep- is obvious that no statistical analysis is possible due to the
resentations to latent layers to reduce over-fitting while sta- low number of evaluated samples (500 compared to 8, 528
bilizing gradient flow. available samples) and because only one expert completed
that evaluation. However, these numbers strongly suggest
More importantly, we wanted our research to give valu- that our results might have some medical relevance as our
able feedback to doctors. Therefore, we inspected features algorithm appears to mimic diagnosis of doctors.
that our trained AF detector has learned from samples pro-
vided by the Challenge to check whether these features were 4.3 Confidence of The Classifier
matching with ones recognized by professionals. These re-
sults are analyzed in the next section. For a more detailed We created another web page to show recordings which were
description of the network architecture, see appendix A. the easiest or the hardest to classify for our algorithm. To
measure the ”confidence” of the decision, we used the out-
4. RESULTS put of the last layer of our network (also called soft-max
4.1 Main Results layer) which has three neurons and each neuron produces
a number that correlates with the assumed probability of
Detecting the four categories: Normal, AF, Other and Noisy belonging to the normal, AF, or other classes, respectively.
in terms of the official, F1 metric of the challenge, our pro- The fourth, noisy class is predicted by a separate network.
posed algorithm has scored 0.88, 0.80, 0.69, 0.64 points re- We fed all recordings to the model and picked the top 10
spectively, and 0.79 on average. The fact that our F1 score recordings which produced the highest value from the neu-
0.64 on Noise detection was even higher then the same score ron responsible for the normal class, and we repeated that
of winning teams (see 2) shows that one is capable of reach- experiment for the AF class. We assumed that those record-
ing performance close to the state of the art methods without ings can also be interesting that were difficult to decide for
professional feature-engineering. our model, and therefore we selected the worse 10-10 record-
ings that resulted in the lowest value from the neurons of the
4.2 Ambiguity of Annotations normal and AF class. The reason why we excluded other
and noisy classes from examination are that these classes
Using the website we designed for the alternative annotation, are only technically necessary for defining the problem, but
Expert-1 annotated 500 recordings. Comparing that anno- they have no medical relevance regarding AF detection.
tation to the annotation of the cardiologists of the Challenge,
we found that the two annotations showed matching only in Then, we asked our experts to try to find some common fea-
65% of cases, underlining the fact that classification of data tures of the samples classified into the same classes by our
set we worked on is challenging even for experts. Moreover, model, and tell whether recordings classified ”confidently”
it turned out that considering only those recordings when (i.e. with high output value) by our model were also evi-
both Expert-1 and the cardiologists of the challenge agreed dent for them. Similarly, we wanted to know whether they
on the classification (i.e., in case of the ”evident recordings”) found the least ”confidently” classified recordings obscure,
the model also presented an almost identical (97.35%) clas- too. They answered independently from each other, but
sification. their remarks were very similar in most aspects.
To visualize the overlap between the 3 annotations we also They both agreed that in the case of most confident pre-
drew Venn diagrams, see Figure 2. We created diagrams for dictions recordings had low noise contamination and this
each class and marked with red the number of the samples contamination could be easily distinguished from the signal.
StuCoSReC Proceedings of the 2019 6th Student Computer Science Research Conference 77
Koper, Slovenia, 10 October
104 70 43 102
32 64 128 256 + + +
preprocess 10 12 23 4 73 5 36 6
F1=0.76
1 1 6 4
concat Multi-domain
features Normal AF Other Noisy
32 ~ 2 concat 256 ~ 1 F1=0.79
32 ~ 4 256 ~ 1
pool pool 256 ~ 1 Figure 2: Venn diagrams showing the overlap be-
64 ~ 1 tween the 3 annotations: the official labels created
64 ~ 2 by the cardiologists of the Challenge (green circle),
64 ~ 4 Expert-1’s annotation (blue circle) and the classifi-
cation of the neural network (red circle).
pool concat
128 ~ 1
128 ~ 2
128 ~ 4
F1=0.77
Figure 1: Learning representations from raw time-
series and equal length spectrogram.
networks on individual domains. We performed hyperpa- that were unambiguous for cardiologists (i.e., the classifi-
rameter tuning in each domain separately, and then we se- cation of Expert-1 and the cardiologists of the Challenge
lected the best performing models for the joint optimization. was the same). It is clearly visible that for the vast major-
ity of these evident samples, the neural network predicted
The upper branch operating on the raw signal is inspired by the same class as the cardiologists did. Additionally, only a
EncodeNet [24] and uses consecutive residual blocks, which tiny fraction of samples (their number is colored to green)
operate with high numbers of channels on the downscaled were classified by our model in such a way that none of the
sample. The lower branch operating on spectral-domain is cardiologists agrees with its prediction. Unfortunately, it
the SkipFCN [25], which connects the early low-level rep- is obvious that no statistical analysis is possible due to the
resentations to latent layers to reduce over-fitting while sta- low number of evaluated samples (500 compared to 8, 528
bilizing gradient flow. available samples) and because only one expert completed
that evaluation. However, these numbers strongly suggest
More importantly, we wanted our research to give valu- that our results might have some medical relevance as our
able feedback to doctors. Therefore, we inspected features algorithm appears to mimic diagnosis of doctors.
that our trained AF detector has learned from samples pro-
vided by the Challenge to check whether these features were 4.3 Confidence of The Classifier
matching with ones recognized by professionals. These re-
sults are analyzed in the next section. For a more detailed We created another web page to show recordings which were
description of the network architecture, see appendix A. the easiest or the hardest to classify for our algorithm. To
measure the ”confidence” of the decision, we used the out-
4. RESULTS put of the last layer of our network (also called soft-max
4.1 Main Results layer) which has three neurons and each neuron produces
a number that correlates with the assumed probability of
Detecting the four categories: Normal, AF, Other and Noisy belonging to the normal, AF, or other classes, respectively.
in terms of the official, F1 metric of the challenge, our pro- The fourth, noisy class is predicted by a separate network.
posed algorithm has scored 0.88, 0.80, 0.69, 0.64 points re- We fed all recordings to the model and picked the top 10
spectively, and 0.79 on average. The fact that our F1 score recordings which produced the highest value from the neu-
0.64 on Noise detection was even higher then the same score ron responsible for the normal class, and we repeated that
of winning teams (see 2) shows that one is capable of reach- experiment for the AF class. We assumed that those record-
ing performance close to the state of the art methods without ings can also be interesting that were difficult to decide for
professional feature-engineering. our model, and therefore we selected the worse 10-10 record-
ings that resulted in the lowest value from the neurons of the
4.2 Ambiguity of Annotations normal and AF class. The reason why we excluded other
and noisy classes from examination are that these classes
Using the website we designed for the alternative annotation, are only technically necessary for defining the problem, but
Expert-1 annotated 500 recordings. Comparing that anno- they have no medical relevance regarding AF detection.
tation to the annotation of the cardiologists of the Challenge,
we found that the two annotations showed matching only in Then, we asked our experts to try to find some common fea-
65% of cases, underlining the fact that classification of data tures of the samples classified into the same classes by our
set we worked on is challenging even for experts. Moreover, model, and tell whether recordings classified ”confidently”
it turned out that considering only those recordings when (i.e. with high output value) by our model were also evi-
both Expert-1 and the cardiologists of the challenge agreed dent for them. Similarly, we wanted to know whether they
on the classification (i.e., in case of the ”evident recordings”) found the least ”confidently” classified recordings obscure,
the model also presented an almost identical (97.35%) clas- too. They answered independently from each other, but
sification. their remarks were very similar in most aspects.
To visualize the overlap between the 3 annotations we also They both agreed that in the case of most confident pre-
drew Venn diagrams, see Figure 2. We created diagrams for dictions recordings had low noise contamination and this
each class and marked with red the number of the samples contamination could be easily distinguished from the signal.
StuCoSReC Proceedings of the 2019 6th Student Computer Science Research Conference 77
Koper, Slovenia, 10 October