Page 221 - Petelin, Ana. 2021. Ed. Zdravje starostnikov / Health of the Elderly. Proceedings. Koper: University of Primorska Press.
P. 221
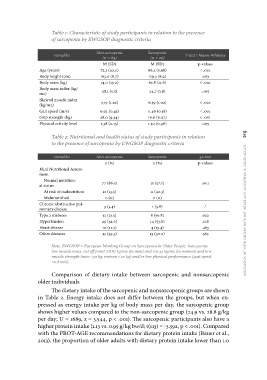
le 1: Characteristic of study participants in relation to the presence
of sarcopenia by EWGSOP diagnostic criteria
Variables Non sarcopenic Sarcopenic T-test / Mann-Whitney
(n = 89) (n = 26)
Age (years) M (SD) M (SD) p-values
Body height (cm) 75.2 (10.0) < .001
Body mass (kg) 163.0 (8.7) 86.2 (5.98) .063
Body mass index (kg/ 74.0 (13.0) 159.3 (8.9) < .001
m2) 62.8 (11.6)
Skeletal muscle index 28.1 (5.5) .005
(kg/m2) 24.7 (3.8)
Gait speed (m/s) 7.79 (1.22) < .001
Grip strength (kg) 6.59 (1.02)
Physical activity level 0.92 (0.43) < .001
28.0 (9.34) 0.46 (0.18) < .001
1.38 (0.13) 16.6 (6.07) .005
1.30 (0.96)
Table 2: Nutritional and health status of study participants in relation association between dietary nutrient intake and sarcopenia in older adults 219
to the presence of sarcopenia by EWGSOP diagnostic criteria
Variables Non sarcopenic Sarcopenic χ2-test
n (%) n (%) p-values
Mini Nutritional Assess-
ment 77 (86.5) 15 (57.7) .001
Normal nutrition- 12 (13.5) 11 (42.3)
al status /
At risk of malnutrition 0 (0) 0 (0) .022
Malnourished 3 (3.4) 1 (3.8) .018
Chronic obstructive pul- 12 (13.5) 8 (30.8) .463
monary disease 29 (32.6) 14 (53.8) .365
Type 2 diabetes 10 (11.2) 4 (15.4)
Hypertension 35 (39.3) 13 (50.0)
Heart disease
Other diseases
Note. EWGSOP = European Working Group on Sarcopenia in Older People. Sarcopenia:
low muscle mass, cut off point ≤8.87 kg/m2 (in men) and ≤6.42 kg/m2 (in women) and low
muscle strength (men <30 kg; women <20 kg) and/or low physical performance (gait speed
<0.8 m/s).
Comparison of dietary intake between sarcopenic and nonsarcopenic
older individuals
The dietary intake of the sarcopenic and nonsarcopenic groups are shown
in Table 2. Energy intake does not differ between the groups, but when ex-
pressed as energy intake per kg of body mass per day, the sarcopenic group
shows higher values compared to the non-sarcopenic group (24.9 vs. 28.8 g/kg
per day; U = 1689, z = 3.544, p < .001). The sarcopenic participants also have a
higher protein intake (1.13 vs. 0.95 g/kg bw/d; t(113) = -3.592, p < .001). Compared
with the PROT-AGE recommendations for dietary protein intake (Bauer et al.,
2013), the proportion of older adults with dietary protein intake lower than 1.0