Page 223 - Petelin, Ana. 2021. Ed. Zdravje starostnikov / Health of the Elderly. Proceedings. Koper: University of Primorska Press.
P. 223
Characteristic Non sarcopenic Sarcopenic T-test / Mann-Whitney association between dietary nutrient intake and sarcopenia in older adults 221
(n = 89) (n = 26)
Vitamin K (μg) 138 (112) 77.7 (27.2) .002
Vitamin C (mg) 57.7 (18.5) .036
Vitamin B1 (mg) 76.6 (39.8) 0.76 (0.11) .002
Vitamin B2 (mg) 0.97 (0.33) 1.24 (0.23) .714
Vitamin B5 (mg) 1.27 (0.31) 3.51 (0.63) .072
Vitamin B6 (mg) 3.91 (0.97) 1.15 (0.19) .091
Vitamin B7 (μg) 1.34 (0.44) 12.8 (5.03) .001
Vitamin B9 (mg) 20.1 (11.2) < .001
Vitamin B12 (μg) 0.21 (0.08) 0.15 (0.02) .349
Potassium (g) 2.89 (1.29) 2.55 (0.54) .131
Calcium (g) 2.54 (0.58) 2.31 (0.39) .161
Magnesium (g) 0.74 (0.22) 0.81 (0.18) .166
Phosphorus (g) 0.32 (0.12) 0.27 (0.04) .570
Iron (g) 1.02 (0.25) 0.99 (0.20) .088
Copper (mg) 13.1 (3.68) 11.8 (2.12) .290
Selenium (μg) 1.37 (0.40) 1.30 (0.24) .175
Zinc (mg) 51.0 (16.6) 45.1 (12.9) .784
7.90 (1.99) 7.65 (0.29)
Note. BM – body mass, BCAA – branched-chain amino acid, Vitamin B1 – thiamine,
Vitamin B2 – riboflavin, Vitamin B5 – pantothenic acid, Vitamin B7 – biotin, Vitamin B9
– folate.
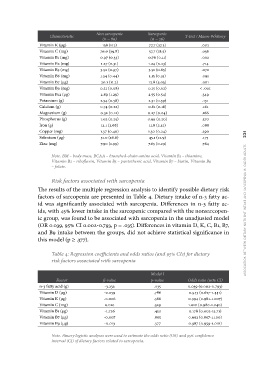
Risk factors associated with sarcopenia
The results of the multiple regression analysis to identify possible dietary risk
factors of sarcopenia are presented in Table 4. Dietary intake of n-3 fatty ac-
id was significantly associated with sarcopenia. Differences in n-3 fatty ac-
ids, with 45% lower intake in the sarcopenic compared with the nonsarcopen-
ic group, was found to be associated with sarcopenia in the unadjusted model
(OR 0.039, 95% CI 0.002-0.793, p = .035). Differences in vitamin D, K, C, B1, B7,
and B9 intake between the groups, did not achieve statistical significance in
this model (p ≥ .377).
Table 4: Regression coefficients and odds ratios (and 95% CIs) for dietary
risk factors associated with sarcopenia
Factor ß-value Model I Odds ratio (95% CI)
n-3 fatty acid (g) -3.232 0.039 (0.002-0.793)
Vitamin D (μg) -0.059 p-value 0.943 (0.617-1.441)
Vitamin K (µg) -0.006 .035 0.994 (0.981-1.007)
Vitamin C (mg) 0.010 .786 1.010 (0.980-1.040)
Vitamin B1 (μg) -1.726 .386 0.178 (0.002-15.71)
Vitamin B7 (μg) -0.007 .529 0.993 (0.897-1.100)
Vitamin B9 (μg) -0.013 .450 0.987 (0.959-1.016)
.895
.377
Note. Binary logistic analyses were used to estimate the odds ratio (OR) and 95% confidence
interval (CI) of dietary factors related to sarcopenia.
(n = 89) (n = 26)
Vitamin K (μg) 138 (112) 77.7 (27.2) .002
Vitamin C (mg) 57.7 (18.5) .036
Vitamin B1 (mg) 76.6 (39.8) 0.76 (0.11) .002
Vitamin B2 (mg) 0.97 (0.33) 1.24 (0.23) .714
Vitamin B5 (mg) 1.27 (0.31) 3.51 (0.63) .072
Vitamin B6 (mg) 3.91 (0.97) 1.15 (0.19) .091
Vitamin B7 (μg) 1.34 (0.44) 12.8 (5.03) .001
Vitamin B9 (mg) 20.1 (11.2) < .001
Vitamin B12 (μg) 0.21 (0.08) 0.15 (0.02) .349
Potassium (g) 2.89 (1.29) 2.55 (0.54) .131
Calcium (g) 2.54 (0.58) 2.31 (0.39) .161
Magnesium (g) 0.74 (0.22) 0.81 (0.18) .166
Phosphorus (g) 0.32 (0.12) 0.27 (0.04) .570
Iron (g) 1.02 (0.25) 0.99 (0.20) .088
Copper (mg) 13.1 (3.68) 11.8 (2.12) .290
Selenium (μg) 1.37 (0.40) 1.30 (0.24) .175
Zinc (mg) 51.0 (16.6) 45.1 (12.9) .784
7.90 (1.99) 7.65 (0.29)
Note. BM – body mass, BCAA – branched-chain amino acid, Vitamin B1 – thiamine,
Vitamin B2 – riboflavin, Vitamin B5 – pantothenic acid, Vitamin B7 – biotin, Vitamin B9
– folate.
Risk factors associated with sarcopenia
The results of the multiple regression analysis to identify possible dietary risk
factors of sarcopenia are presented in Table 4. Dietary intake of n-3 fatty ac-
id was significantly associated with sarcopenia. Differences in n-3 fatty ac-
ids, with 45% lower intake in the sarcopenic compared with the nonsarcopen-
ic group, was found to be associated with sarcopenia in the unadjusted model
(OR 0.039, 95% CI 0.002-0.793, p = .035). Differences in vitamin D, K, C, B1, B7,
and B9 intake between the groups, did not achieve statistical significance in
this model (p ≥ .377).
Table 4: Regression coefficients and odds ratios (and 95% CIs) for dietary
risk factors associated with sarcopenia
Factor ß-value Model I Odds ratio (95% CI)
n-3 fatty acid (g) -3.232 0.039 (0.002-0.793)
Vitamin D (μg) -0.059 p-value 0.943 (0.617-1.441)
Vitamin K (µg) -0.006 .035 0.994 (0.981-1.007)
Vitamin C (mg) 0.010 .786 1.010 (0.980-1.040)
Vitamin B1 (μg) -1.726 .386 0.178 (0.002-15.71)
Vitamin B7 (μg) -0.007 .529 0.993 (0.897-1.100)
Vitamin B9 (μg) -0.013 .450 0.987 (0.959-1.016)
.895
.377
Note. Binary logistic analyses were used to estimate the odds ratio (OR) and 95% confidence
interval (CI) of dietary factors related to sarcopenia.