
Page 204 - Changing Living Spaces
P. 204
Masanori Takashima
Early Modern Period (Tokugawa Period)
There is little data on cultivated land in the early modern period relative to
data on the scale of agricultural production. The only existing documen-
tation includes information recorded under the Tokugawa shogunate in
1721, the midpoint of the early modern period. Quantitative data on ara-
ble land at the nationwide level were not available until the beginning of
the modern period, more than 150 years later. In the context of Japanese
economic history, it has been pointed out that proto-industrialisation in
Japan progressed from the mid-eighteenth century (Saito 1985). In this
context, even these two limited benchmarks can provide sufficient evi-
dence to understand how proto-industrialisation affected the expansion
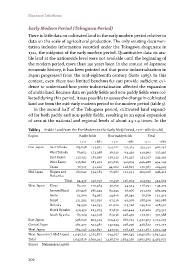
of arable land. Because data on paddy fields and non-paddy fields were col-
lected during this period, it was possible to assess the change in cultivated
land use from the mid-early modern period to the modern period (table 5).
In the second half of the Tokugawa period, cultivated land expand-
ed for both paddy and non-paddy fields, resulting in an equal expansion
of area at the national and regional levels of about 1.5-1.9 times. In the
Table 5 Arable Land from the Pre-Modern to the Early Meiji Period, 1721–1882 (in chō)
Region Paddy fields Non-paddy fields Total
1721 1882 1721 1882 1721 1882
East Japan East Tōhoku 183,648 273,927 154,102 232,315 337,750 506,242
West Tōhoku 83,652 173,058 36,310 64,439 119,962 237,497
East Kantō 117,202 181,956 136,315 161,437 253,517 343,393
West Kantō 136,861 183,472 303,626 310,674 440,488 494,145
Tōsan 76,727 91,102 94,060 118,827 170,787 209,929
Mid Japan Niigata and 187,042 334,183 76,987 112,232 264,028 446,415
Hokuriku
Tōkai 94,436 198,798 70,358 126,064 164,793 324,862
West Japan Kinai 82,101 110,384 36,150 34,923 118,251 145,307
Around Kinai 187,928 286,943 83,245 78,366 271,173 365,309
Sanin 52,060 84,367 24,616 38,049 76,676 122,416
Sanyō 121,393 202,820 67,116 90,268 188,509 293,088
Shikoku 84,590 142,793 61,020 115,728 145,610 258,521
North Kyūshū 150,452 223,073 87,830 142,444 238,282 365,517
South Kyūshū 85,724 142,518 87,036 228,470 172,761 370,988
East Japan 598,090 903,514 724,413 887,691 1,322,503 1,791,205
Central Japan 281,477 532,981 147,344 238,296 428,822 771,277
West Japan 764,248 1,192,897 447,013 728,248 1,211,261 1,921,145
West Japan (incl. Mid Japan) 1,045,725 1,725,877 594,357 966,545 1,640,082 2,692,422
Total 1,643,816 2,629,392 1,318,770 1,854,236 2,962,585 4,483,627
Source Nakamura (1968).
202