
Page 205 - Changing Living Spaces
P. 205
Wet-Rice Agriculture and Economic Growth in Pre-Industrial Japan
early modern period, which began in the seventeenth century, the pop-
ulation and arable land increased (Takashima 2017; Bassino et al. 2019).
According to Seiryōki, the oldest agricultural book in Japan, said to have
been written at the end of the mediaeval period, houses in rural areas in
the mediaeval period were flanked at the back by mountains; these hous-
es overlooked small valleys and households depended on river water. This
means that in the pre-modern period, rice cultivation was practised in
natural wetlands and development shifted from these areas to diluvial
plateaus; later, from the sixteenth to seventeenth centuries, it shifted to
alluvial plains. This led to a nationwide increase in arable land in the sev-
enteenth century (Hayami and Miyamoto 1989; Saito 1989).
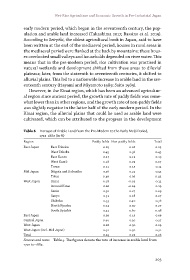
However, in the Kinai region, which has been an advanced agricultur-
al region since ancient period, the growth rate of paddy fields was some-
what lower than in other regions, and the growth rate of non-paddy fields
was slightly negative in the latter half of the early modern period. In the
Kinai region, the alluvial plains that could be used as arable land were
cultivated, which can be attributed to the progress in the development
Table 6 Increase of Arable Land from the Pre-Modern to the Early Meiji Period,
1721–1882 (in %)
Region Paddy fields Non-paddy fields Total
East Japan East Tōhoku 0.25 0.26 0.25
West Tōhoku 0.45 0.36 0.43
East Kantō 0.27 0.11 0.19
West Kantō 0.18 0.01 0.07
Tōsan 0.11 0.15 0.13
Mid Japan Niigata and Hokuriku 0.36 0.23 0.33
Tōkai 0.46 0.36 0.42
West Japan Kinai 0.18 -0.02 0.13
Around Kinai 0.26 -0.04 0.19
Sanin 0.30 0.27 0.29
Sanyō 0.32 0.18 0.27
Shikoku 0.33 0.40 0.36
North Kyūshū 0.24 0.30 0.27
South Kyūshū 0.32 0.60 0.48
East Japan 0.26 0.13 0.19
Central Japan 0.40 0.30 0.37
West Japan 0.28 0.30 0.29
West Japan (incl. Mid Japan) 0.31 0.30 0.31
Total 0.29 0.21 0.26
Sources and notes Table 5. The figures denote the rate of increase in arable land from
1721 to 1882.
203