Page 207 - Hojnik, Jana. 2017. In Persuit of Eco-innovation. Drivers and Consequences of Eco-innovation at Firm Level. Koper: University of Primorska Press
P. 207
Results 207
A confirmatory factor analysis was conducted to validate the findings
of the exploratory factor analysis, which resulted in two factors, an Im-
provement factor composed of nine items and a Reduction factor com-
posed of three items. This scale originally was assumed to be composed
of one factor, and previous researchers also used it as one factor (Sharma
and Vredenburg 1998; Sharma 2001). Therefore, we first conducted con-
firmatory factor analysis in the sense that we put together all 12 items to
measure competitive benefits; second, we conducted a confirmatory fac-
tor analysis in order to validate a two-factor solution.
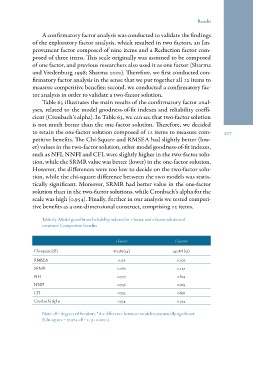
Table 63 illustrates the main results of the confirmatory factor anal-
yses, related to the model goodness-of-fit indexes and reliability coeffi-
cient (Cronbach’s alpha). In Table 63, we can see that two-factor solution
is not much better than the one-factor solution. Therefore, we decided
to retain the one-factor solution composed of 12 items to measure com-
petitive benefits. The Chi-Square and RMSEA had slightly better (low-
er) values in the two-factor solution, other model goodness-of-fit indexes,
such as NFI, NNFI and CFI, were slightly higher in the two-factor solu-
tion, while the SRMR value was better (lower) in the one-factor solution.
However, the differences were too low to decide on the two-factor solu-
tion, while the chi-square difference between the two models was statis-
tically significant. Moreover, SRMR had better value in the one-factor
solution than in the two-factor solutions, while Cronbach’s alpha for the
scale was high (0.954). Finally, further in our analysis we tested competi-
tive benefits as a one-dimensional construct, comprising 12 items.
Table 63: Model good-fit and reliability indexes for 1-factor and 2-factor solution of
construct Competitive benefits
Chi-square (df ) 1 factor 2 factors
RMSEA 613.583 (54) 542.818 (52)
SRMR 0.216 0.206
NFI 0.080 0.227
NNFI 0.777 0.803
CFI 0.746 0.769
Cronbach’s alpha 0.792 0.818
0.954 0.954
Note: df = degrees of freedom; * the difference between models is statistically significant
(Chi-square = 70.765; df = 2; p< 0.0001).
A confirmatory factor analysis was conducted to validate the findings
of the exploratory factor analysis, which resulted in two factors, an Im-
provement factor composed of nine items and a Reduction factor com-
posed of three items. This scale originally was assumed to be composed
of one factor, and previous researchers also used it as one factor (Sharma
and Vredenburg 1998; Sharma 2001). Therefore, we first conducted con-
firmatory factor analysis in the sense that we put together all 12 items to
measure competitive benefits; second, we conducted a confirmatory fac-
tor analysis in order to validate a two-factor solution.
Table 63 illustrates the main results of the confirmatory factor anal-
yses, related to the model goodness-of-fit indexes and reliability coeffi-
cient (Cronbach’s alpha). In Table 63, we can see that two-factor solution
is not much better than the one-factor solution. Therefore, we decided
to retain the one-factor solution composed of 12 items to measure com-
petitive benefits. The Chi-Square and RMSEA had slightly better (low-
er) values in the two-factor solution, other model goodness-of-fit indexes,
such as NFI, NNFI and CFI, were slightly higher in the two-factor solu-
tion, while the SRMR value was better (lower) in the one-factor solution.
However, the differences were too low to decide on the two-factor solu-
tion, while the chi-square difference between the two models was statis-
tically significant. Moreover, SRMR had better value in the one-factor
solution than in the two-factor solutions, while Cronbach’s alpha for the
scale was high (0.954). Finally, further in our analysis we tested competi-
tive benefits as a one-dimensional construct, comprising 12 items.
Table 63: Model good-fit and reliability indexes for 1-factor and 2-factor solution of
construct Competitive benefits
Chi-square (df ) 1 factor 2 factors
RMSEA 613.583 (54) 542.818 (52)
SRMR 0.216 0.206
NFI 0.080 0.227
NNFI 0.777 0.803
CFI 0.746 0.769
Cronbach’s alpha 0.792 0.818
0.954 0.954
Note: df = degrees of freedom; * the difference between models is statistically significant
(Chi-square = 70.765; df = 2; p< 0.0001).