Page 212 - Hojnik, Jana. 2017. In Persuit of Eco-innovation. Drivers and Consequences of Eco-innovation at Firm Level. Koper: University of Primorska Press
P. 212
In Pursuit of Eco-innovation
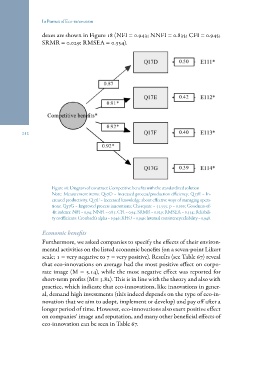
dexes are shown in Figure 18 (NFI = 0.943; NNFI = 0.835; CFI = 0.945;
SRMR = 0.029; RMSEA = 0.334).
212
Figure 18: Diagram of construct Competitive benefits with the standardized solution
Note: Measurement items: Q17D = Increased process/production efficiency; Q17E = In-
creased productivity; Q17F = Increased knowledge about effective ways of managing opera-
tions; Q17G = Improved process innovations; Chi-square = 51.555; p = 0.000; Goodness-of-
-fit indexes: NFI = 0.94; NNFI = 0.83; CFI = 0.94; SRMR = 0.029; RMSEA = 0.334; Reliabili-
ty coefficients: Cronbach’s alpha = 0.946; RHO = 0.946; Internal consistency reliability = 0.948.
Economic benefits
Furthermore, we asked companies to specify the effects of their environ-
mental activities on the listed economic benefits (on a seven-point Likert
scale; 1 = very negative to 7 = very positive). Results (see Table 67) reveal
that eco-innovations on average had the most positive effect on corpo-
rate image (M = 5.14), while the most negative effect was reported for
short-term profits (M= 3.82). This is in line with the theory and also with
practice, which indicate that eco-innovations, like innovations in gener-
al, demand high investments (this indeed depends on the type of eco-in-
novation that we aim to adopt, implement or develop) and pay off after a
longer period of time. However, eco-innovations also exert positive effect
on companies’ image and reputation, and many other beneficial effects of
eco-innovation can be seen in Table 67.