Page 245 - Hojnik, Jana. 2017. In Persuit of Eco-innovation. Drivers and Consequences of Eco-innovation at Firm Level. Koper: University of Primorska Press
P. 245
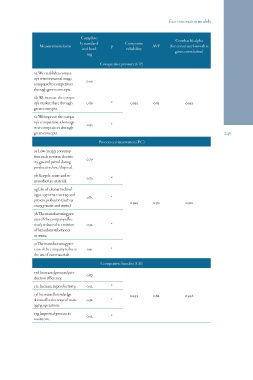
Eco-innovation models
Complete- Cronbach’s alpha
(for construct Growth is
Measurement items ly standard- p Composite AVE
ized load- reliability 0.83 given correlation)
0.933
ing 0.70
0.82 0.912
Competitive pressure (CP)
0.946
6a We establish a compa- 0.90
ny’s environmental image
compared to competitors
through green concepts.
6b We increase the compa-
ny’s market share through 0.89 * 0.933
green concepts.
6c We improve the compa- 0.95 *
ny’s competitive advantage
over competitors through 245
green concepts.
Process eco-innovation (PC)
9a Low energy consump- 0.79
tion such as water, electric-
ity, gas and petrol during
production/use/disposal.
9b Recycle, reuse and re- 0.73 *
manufacture material.
9g Use of cleaner technol- 0.83 *
ogy to generate savings and 0.922
prevent pollution (such as
energy, water and waste).
9h The manufacturing pro- 0.92 *
cess of the company effec-
tively reduces the emission
of hazardous substances
or waste.
9i The manufacturing pro- 0.91 *
cess of the company reduces
the use of raw materials.
Competitive benefits (CB)
17d Increased process/pro- 0.87 *
duction efficiency. 0.92 0.949
0.92
17e Increase in productivity. *
0.92
17f Increased knowledge *
about effective ways of man-
aging operations.
17g Improved process in-
novations.