Page 247 - Hojnik, Jana. 2017. In Persuit of Eco-innovation. Drivers and Consequences of Eco-innovation at Firm Level. Koper: University of Primorska Press
P. 247
Eco-innovation models 247
of average variance extracted (AVE) for each construct is greater than
0.50, except for the construct company growth, for which has not been
calculated (instead, the correlation between the two items related to the
construct is given).
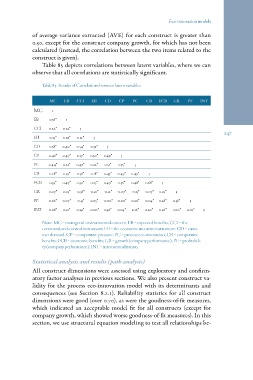
Table 85 depicts correlations between latent variables, where we can
observe that all correlations are statistically significant.
Table 85: Results of Correlations between latent variables
MC EB CCI EII CD CP PC CB ECB GR PF INT
MC 1
EB 0.56* 1
CCI 0.26* 0.22* 1
EII 0.23* 0.29* 0.21* 1
CD 0.38* 0.40* 0.54* 0.19* 1
CP 0.46* 0.47* 0.37* 0.30* 0.49* 1
PC 0.44* 0.22* 0.47* 0.22* 0.51* 0.55* 1
CB 0.28* 0.29* 0.36* 0.18* 0.45* 0.49* 0.49* 1
ECB 0.39* 0.47* 0.30* 0.23* 0.49* 0.56* 0.48* 0.68* 1
GR 0.07* 0.03* -0.38* -0.10* -0.12* -0.07* -0.15* -0.07* 0.01* 1
PF 0.06* 0.07* -0.13* 0.05* -0.00* -0.00* 0.06* -0.04* 0.28* 0.38* 1
INT 0.08* 0.12* 0.29* -0.00* 0.36* 0.04* 0.16* 0.20* 0.26* -0.10* -0.01* 1
Note: MC = managerial environmental concern; EB = expected benefits; CCI = the
command-and-control instrument; EII = the economic incentive instrument; CD = custo-
mer demand; CP = competitive pressure; PC = process eco-innovation; CB = competitive
benefits; ECB = economic benefits; GR = growth (company performance); PF = profitabili-
ty (company performance); INT = internationalization.
Statistical analysis and results (path analysis)
All construct dimensions were assessed using exploratory and confirm-
atory factor analyses in previous sections. We also present construct va-
lidity for the process eco-innovation model with its determinants and
consequences (see Section 8.2.1). Reliability statistics for all construct
dimensions were good (over 0.70), as were the goodness-of-fit measures,
which indicated an acceptable model fit for all constructs (except for
company growth, which showed worse goodness-of-fit measures). In this
section, we use structural equation modeling to test all relationships be-
of average variance extracted (AVE) for each construct is greater than
0.50, except for the construct company growth, for which has not been
calculated (instead, the correlation between the two items related to the
construct is given).
Table 85 depicts correlations between latent variables, where we can
observe that all correlations are statistically significant.
Table 85: Results of Correlations between latent variables
MC EB CCI EII CD CP PC CB ECB GR PF INT
MC 1
EB 0.56* 1
CCI 0.26* 0.22* 1
EII 0.23* 0.29* 0.21* 1
CD 0.38* 0.40* 0.54* 0.19* 1
CP 0.46* 0.47* 0.37* 0.30* 0.49* 1
PC 0.44* 0.22* 0.47* 0.22* 0.51* 0.55* 1
CB 0.28* 0.29* 0.36* 0.18* 0.45* 0.49* 0.49* 1
ECB 0.39* 0.47* 0.30* 0.23* 0.49* 0.56* 0.48* 0.68* 1
GR 0.07* 0.03* -0.38* -0.10* -0.12* -0.07* -0.15* -0.07* 0.01* 1
PF 0.06* 0.07* -0.13* 0.05* -0.00* -0.00* 0.06* -0.04* 0.28* 0.38* 1
INT 0.08* 0.12* 0.29* -0.00* 0.36* 0.04* 0.16* 0.20* 0.26* -0.10* -0.01* 1
Note: MC = managerial environmental concern; EB = expected benefits; CCI = the
command-and-control instrument; EII = the economic incentive instrument; CD = custo-
mer demand; CP = competitive pressure; PC = process eco-innovation; CB = competitive
benefits; ECB = economic benefits; GR = growth (company performance); PF = profitabili-
ty (company performance); INT = internationalization.
Statistical analysis and results (path analysis)
All construct dimensions were assessed using exploratory and confirm-
atory factor analyses in previous sections. We also present construct va-
lidity for the process eco-innovation model with its determinants and
consequences (see Section 8.2.1). Reliability statistics for all construct
dimensions were good (over 0.70), as were the goodness-of-fit measures,
which indicated an acceptable model fit for all constructs (except for
company growth, which showed worse goodness-of-fit measures). In this
section, we use structural equation modeling to test all relationships be-