Page 32 - Fister jr., Iztok, Andrej Brodnik, Matjaž Krnc and Iztok Fister (eds.). StuCoSReC. Proceedings of the 2019 6th Student Computer Science Research Conference. Koper: University of Primorska Press, 2019
P. 32
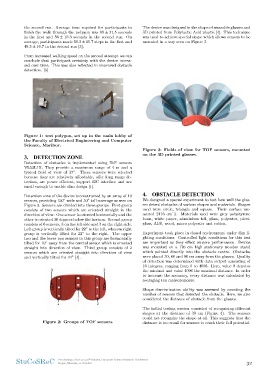
second run. Average time required for participants to The device was designed in the shape of wearable glasses and
finish the walk through the polygon was 80 ± 31.5 seconds 3D printed from Polylactic Acid plastic [4]. This technique
in the first and 56 ± 18.3 seconds in the second run. On was used to achieve special shape which allows sensors to be
average, participants made 56.2 ± 15.7 steps in the first and mounted in a way seen on Figure 3
48.3 ± 10.7 in the second run [3].
From increased walking speed on the second attempt we can
conclude that participant certainty with the device increa-
sed over time. This was also reflected in improved obstacle
detection. [3]
Figure 1: test polygon, set up in the main lobby of Figure 3: Fields of view for TOF sensors, mounted
the Faculty of Electrical Engineering and Computer on the 3D printed glasses.
Science, Maribor.
4. OBSTACLE DETECTION
3. DETECTION ZONE
We designed a special experiment to test how well the glas-
Detection of obstacles is implemented using ToF sensors ses detect obstacles of various shapes and materials. Shapes
VL53L1X. They provide a maximum range of 4 m and a used were circle, triangle and square. Their surface me-
typical field of view of 27◦. These sensors were selected asured 2116 cmˆ2. Materials used were grey polystyrene
because they are relatively affordable, offer long range de- foam, white paper, aluminium foil, glass, polyester, plexi-
tection, are power efficient, support I2C interface and are glass, ABS, wood, micro polyester and cotton.
small enough to enable slim design [1].
Experiment took place in closed environment under dim li-
Detection zone of the device is constructed by an array of 10 ghting conditions. Controlled light conditions for this test
sensors, providing 150◦ wide and 50◦ tall coverage as seen on are important as they effect sensors performance. Device
Figure 3. Sensors are divided into three groups. First group was mounted on a 176 cm high stationary wooden stand
consists of two sensors which are oriented straight in the which pointed directly into the obstacle centre. Obstacles
direction of view. One sensor is oriented horizontally and the were placed 30, 60 and 90 cm away from the glasses. Quality
other is oriented 30 degrees below the horizon. Second group of detection was determined with data output consisting of
consists of 6 sensors, 3 on the left side and 3 on the right side. 10 integers, ranging from 0 to 4096. Here, value 0 denotes
Left group is vertically tilted for 22◦ to the left, whereas right the minimal and value 4096 the maximal distance. In order
group is vertically tilted for 22◦ to the right. The upper to increase the accuracy, every distance was calculated by
two and the lower two sensors in this group are horizontally averaging ten measurements.
tilted for 10◦ away from the central sensor which is oriented
straight into direction of view. Third group consists of 2 Shape discrimination ability was assessed by counting the
sensors which are oriented straight into direction of view number of sensors that detected the obstacle. Here, we also
and vertically tilted for 44◦ [4]. considered the distance of obstacle from the glasses.
Figure 2: Groups of TOF sensors. The initial testing session consisted of recognizing different
shapes at the distance of 30 cm (Figure 4). The sensors
could not recognize the shape at all. This suggests that the
distance is too small for sensors to reach their full potential.
StuCoSReC Proceedings of the 2019 6th Student Computer Science Research Conference 32
Koper, Slovenia, 10 October