Page 33 - Fister jr., Iztok, Andrej Brodnik, Matjaž Krnc and Iztok Fister (eds.). StuCoSReC. Proceedings of the 2019 6th Student Computer Science Research Conference. Koper: University of Primorska Press, 2019
P. 33
ure 4: Results of obstacle detection at the dis- Figure 6: Results of obstacle detection at the dis-
tance of 30 cm. tance of 90 cm.
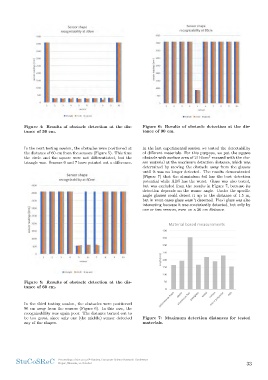
In the next testing session, the obstacles were positioned at In the last experimental session we tested the detectability
the distance of 60 cm from the sensors (Figure 5). This time of different materials. For this purpose, we put the square
the circle and the square were not differentiated, but the obstacle with surface area of 2116 cm2 encased with the cho-
triangle was. Sensors 6 and 7 have pointed out a difference. sen material at the maximum detection distance, which was
determined by moving the obstacle away from the glasses
until it was no longer detected. The results demonstrated
(Figure 7) that the aluminium foil has the best detection
potential while ABS has the worst. Glass was also tested,
but was excluded from the results in Figure 7, because its
detection depends on the sensor angle. Under the specific
angle glasses could detect it up to the distance of 1.5 m,
but in most cases glass wasn’t detected. Plexi glass was also
interesting because it was consistently detected, but only by
one or two sensors, even on a 30 cm distance.
Figure 5: Results of obstacle detection at the dis-
tance of 60 cm.
In the third testing session, the obstacles were positioned Figure 7: Maximum detection distances for tested
90 cm away from the sensors (Figure 6). In this case, the materials.
recognizability was again poor. The distance turned out to
be too great, since only one (the middle) sensor detected
any of the shapes.
StuCoSReC Proceedings of the 2019 6th Student Computer Science Research Conference 33
Koper, Slovenia, 10 October
tance of 30 cm. tance of 90 cm.
In the next testing session, the obstacles were positioned at In the last experimental session we tested the detectability
the distance of 60 cm from the sensors (Figure 5). This time of different materials. For this purpose, we put the square
the circle and the square were not differentiated, but the obstacle with surface area of 2116 cm2 encased with the cho-
triangle was. Sensors 6 and 7 have pointed out a difference. sen material at the maximum detection distance, which was
determined by moving the obstacle away from the glasses
until it was no longer detected. The results demonstrated
(Figure 7) that the aluminium foil has the best detection
potential while ABS has the worst. Glass was also tested,
but was excluded from the results in Figure 7, because its
detection depends on the sensor angle. Under the specific
angle glasses could detect it up to the distance of 1.5 m,
but in most cases glass wasn’t detected. Plexi glass was also
interesting because it was consistently detected, but only by
one or two sensors, even on a 30 cm distance.
Figure 5: Results of obstacle detection at the dis-
tance of 60 cm.
In the third testing session, the obstacles were positioned Figure 7: Maximum detection distances for tested
90 cm away from the sensors (Figure 6). In this case, the materials.
recognizability was again poor. The distance turned out to
be too great, since only one (the middle) sensor detected
any of the shapes.
StuCoSReC Proceedings of the 2019 6th Student Computer Science Research Conference 33
Koper, Slovenia, 10 October