Page 179 - Petelin, Ana. 2021. Ed. Zdravje starostnikov / Health of the Elderly. Proceedings. Koper: University of Primorska Press.
P. 179
age group 65 to 75 years there were 68.3% and in the oldest age group 31.7%
of the elderly. The research was conducted by means of a structured interview
with individuals. A short questionnaire on healthy/unhealthy diet (Koch et al.,
2014) was used to assess their eating habits and other aspects of their quality
of life. For statistical analysis, we used the computer program SPSS version 26.
Using the descriptive method, we describe the sample and results using the fre-
quency distribution of responses and mean scores. Statistically significant dif-
ferences in the variables were determined using the Mann Whitney test. For
statistical inference, we considered 0.05 risk levels.
Results quality of life of the elderly in intergenerational cooperation and learning programs 177
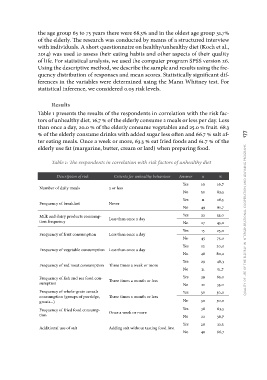
Table 1 presents the results of the respondents in correlation with the risk fac-
tors of unhealthy diet. 16.7 % of the elderly consume 2 meals or less per day. Less
than once a day, 20.0 % of the elderly consume vegetables and 25.0 % fruit. 68.3
% of the elderly consume drinks with added sugar less often and 66.7 % salt af-
ter eating meals. Once a week or more, 63.3 % eat fried foods and 61.7 % of the
elderly use fat (margarine, butter, cream or lard) when preparing food.
Table 1: The respondents in correlation with risk factors of unhealthy diet
Description of risk Criteria for unhealthy behaviour Answer n %
Number of daily meals 2 or less Yes 10 16,7
Never No 50 83,3
Frequency of breakfast Less than once a day Yes 11 18,3
Milk and dairy products consump- Less than once a day No 49 81,7
tion frequency Less than once a day Yes 33 55,0
Frequency of fruit consumption Three times a week or more No 27 45,0
Three times a month or less Yes 15 25,0
Frequency of vegetable consumption Three times a month or less No 45 75,0
Once a week or more Yes 12 20,0
Frequency of red meat consumption Adding salt without tasting food first No 48 80,0
Frequency of fish and sea food con- Yes 29 48,3
sumption No 31 51,7
Frequency of whole-grain cereals Yes 39 65,0
consumption (groups of porridge, No 21 35,0
groats...) Yes 30 50,0
Frequency of fried food consump- No 30 50,0
tion Yes 38 63,3
Additional use of salt No 22 36,7
Yes 20 33,3
No 40 66,7
of the elderly. The research was conducted by means of a structured interview
with individuals. A short questionnaire on healthy/unhealthy diet (Koch et al.,
2014) was used to assess their eating habits and other aspects of their quality
of life. For statistical analysis, we used the computer program SPSS version 26.
Using the descriptive method, we describe the sample and results using the fre-
quency distribution of responses and mean scores. Statistically significant dif-
ferences in the variables were determined using the Mann Whitney test. For
statistical inference, we considered 0.05 risk levels.
Results quality of life of the elderly in intergenerational cooperation and learning programs 177
Table 1 presents the results of the respondents in correlation with the risk fac-
tors of unhealthy diet. 16.7 % of the elderly consume 2 meals or less per day. Less
than once a day, 20.0 % of the elderly consume vegetables and 25.0 % fruit. 68.3
% of the elderly consume drinks with added sugar less often and 66.7 % salt af-
ter eating meals. Once a week or more, 63.3 % eat fried foods and 61.7 % of the
elderly use fat (margarine, butter, cream or lard) when preparing food.
Table 1: The respondents in correlation with risk factors of unhealthy diet
Description of risk Criteria for unhealthy behaviour Answer n %
Number of daily meals 2 or less Yes 10 16,7
Never No 50 83,3
Frequency of breakfast Less than once a day Yes 11 18,3
Milk and dairy products consump- Less than once a day No 49 81,7
tion frequency Less than once a day Yes 33 55,0
Frequency of fruit consumption Three times a week or more No 27 45,0
Three times a month or less Yes 15 25,0
Frequency of vegetable consumption Three times a month or less No 45 75,0
Once a week or more Yes 12 20,0
Frequency of red meat consumption Adding salt without tasting food first No 48 80,0
Frequency of fish and sea food con- Yes 29 48,3
sumption No 31 51,7
Frequency of whole-grain cereals Yes 39 65,0
consumption (groups of porridge, No 21 35,0
groats...) Yes 30 50,0
Frequency of fried food consump- No 30 50,0
tion Yes 38 63,3
Additional use of salt No 22 36,7
Yes 20 33,3
No 40 66,7