Page 84 - Štemberger Tina, Čotar Konrad Sonja, Rutar Sonja, Žakelj Amalija. Ur. 2022. Oblikovanje inovativnih učnih okolij. Koper: Založba Univerze na Primorskem
P. 84
ko Rajović
Not at all 2.9
I don’t like
Moderately 18.0
19.2
I like
I like very much 34.9
25.0
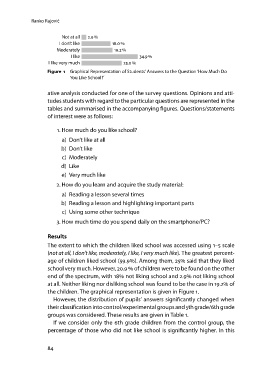
Figure 1 Graphical Representation of Students’ Answers to the Question ‘How Much Do
You Like School?’
ative analysis conducted for one of the survey questions. Opinions and atti-
tudes students with regard to the particular questions are represented in the
tables and summarised in the accompanying figures. Questions/statements
of interest were as follows:
1. How much do you like school?
a) Don’t like at all
b) Don’t like
c) Moderately
d) Like
e) Very much like
2. How do you learn and acquire the study material:
a) Reading a lesson several times
b) Reading a lesson and highlighting important parts
c) Using some other technique
3. How much time do you spend daily on the smartphone/PC?
Results
The extent to which the children liked school was accessed using 1–5 scale
(not at all, I don’t like, moderately, I like, I very much like). The greatest percent-
age of children liked school (59.9). Among them, 25 said that they liked
school very much. However, 20.9 of children were to be found on the other
end of the spectrum, with 18 not liking school and 2.9 not liking school
at all. Neither liking nor disliking school was found to be the case in 19.2 of
the children. The graphical representation is given in Figure 1.
However, the distribution of pupils’ answers significantly changed when
their classification into control/experimental groups and 5th grade/6th grade
groups was considered. These results are given in Table 1.
If we consider only the 6th grade children from the control group, the
percentage of those who did not like school is significantly higher. In this
84
Not at all 2.9
I don’t like
Moderately 18.0
19.2
I like
I like very much 34.9
25.0
Figure 1 Graphical Representation of Students’ Answers to the Question ‘How Much Do
You Like School?’
ative analysis conducted for one of the survey questions. Opinions and atti-
tudes students with regard to the particular questions are represented in the
tables and summarised in the accompanying figures. Questions/statements
of interest were as follows:
1. How much do you like school?
a) Don’t like at all
b) Don’t like
c) Moderately
d) Like
e) Very much like
2. How do you learn and acquire the study material:
a) Reading a lesson several times
b) Reading a lesson and highlighting important parts
c) Using some other technique
3. How much time do you spend daily on the smartphone/PC?
Results
The extent to which the children liked school was accessed using 1–5 scale
(not at all, I don’t like, moderately, I like, I very much like). The greatest percent-
age of children liked school (59.9). Among them, 25 said that they liked
school very much. However, 20.9 of children were to be found on the other
end of the spectrum, with 18 not liking school and 2.9 not liking school
at all. Neither liking nor disliking school was found to be the case in 19.2 of
the children. The graphical representation is given in Figure 1.
However, the distribution of pupils’ answers significantly changed when
their classification into control/experimental groups and 5th grade/6th grade
groups was considered. These results are given in Table 1.
If we consider only the 6th grade children from the control group, the
percentage of those who did not like school is significantly higher. In this
84