Page 239 - Hojnik, Jana. 2017. In Persuit of Eco-innovation. Drivers and Consequences of Eco-innovation at Firm Level. Koper: University of Primorska Press
P. 239
Eco-innovation models
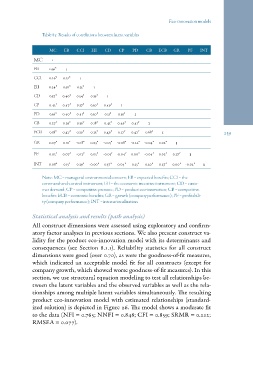
Table 83: Results of correlations between latent variables
MC EB CCI EII CD CP PD CB ECB GR PF INT 239
MC 1
EB 0.56* 1
CCI 0.26* 0.22* 1
EII 0.24* 0.30* 0.21* 1
CD 0.37* 0.40* 0.54* 0.19* 1
CP 0.45* 0.47* 0.37* 0.30* 0.49* 1
PD 0.36* 0.40* 0.41* 0.30* 0.51* 0.59* 1
CB 0.27* 0.29* 0.36* 0.18* 0.45* 0.49* 0.41* 1
ECB 0.38* 0.47* 0.30* 0.23* 0.49* 0.57* 0.47* 0.68* 1
GR 0.07* 0.10* -0.18* 0.03* -0.05* -0.08* -0.22* -0.04* 0.02* 1
PF 0.05* 0.07* -0.12* 0.05* -0.03* -0.04* 0.00* -0.04* 0.02* 0.27* 1
INT 0.08* 0.13* 0.29* -0.00* 0.37* 0.04* 0.25* 0.20* 0.27* 0.00* -0.02* 1
Note: MC = managerial environmental concern; EB = expected benefits; CCI = the
command-and-control instrument; EII = the economic incentive instrument; CD = custo-
mer demand; CP = competitive pressure; PD = product eco-innovation; CB = competitive
benefits; ECB = economic benefits; GR = growth (company performance); PF = profitabili-
ty (company performance); INT = internationalization.
Statistical analysis and results (path analysis)
All construct dimensions were assessed using exploratory and confirm-
atory factor analyses in previous sections. We also present construct va-
lidity for the product eco-innovation model with its determinants and
consequences (see Section 8.1.1). Reliability statistics for all construct
dimensions were good (over 0.70), as were the goodness-of-fit measures,
which indicated an acceptable model fit for all constructs (except for
company growth, which showed worse goodness-of-fit measures). In this
section, we use structural equation modeling to test all relationships be-
tween the latent variables and the observed variables as well as the rela-
tionships among multiple latent variables simultaneously. The resulting
product eco-innovation model with estimated relationships (standard-
ized solution) is depicted in Figure 26. The model shows a moderate fit
to the data (NFI = 0.763; NNFI = 0.848; CFI = 0.859; SRMR = 0.212;
RMSEA = 0.077).