Page 213 - Hojnik, Jana. 2017. In Persuit of Eco-innovation. Drivers and Consequences of Eco-innovation at Firm Level. Koper: University of Primorska Press
P. 213
Results
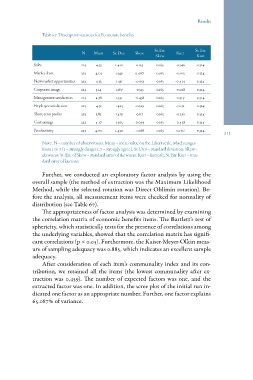
Table 67: Descriptive statistics for Economic benefits
N Mean St. Dev. Skew St. Err. Kurt St. Err.
Skew Kurt
Sales 223 4.33 1.410 0.153 -0.346 213
Market share 223 4.02 1.349 0.067 0.163 -0.015 0.324
New market opportunities 223 4.32 1.431 -0.053 0.163 -0.414 0.324
Corporate image 223 5.14 1.367 -0.553 0.163 -0.028 0.324
Management satisfaction 223 4.78 1.531 -0.438 0.163 -0.317 0.324
Employee satisfaction 223 4.52 1.423 -0.329 0.163 -0.132 0.324
Short-term profits 223 3.82 1.419 0.111 0.163 -0.261 0.324
Cost savings 223 4.17 1.505 -0.094 0.163 -0.428 0.324
Productivity 223 4.00 1.430 -0.168 0.163 0.170 0.324
0.163 0.324
Note: N = number of observations; Mean = mean value on the Likert scale, which ranges
from 1 to 7 (1 = strongly disagree, 7 = strongly agree); St. Dev. = standard deviation; Skew =
skewness; St. Err. of Skew = standard error of skewness; Kurt = kurtosis; St. Err. Kurt = stan-
dard error of kurtosis.
Further, we conducted an exploratory factor analysis by using the
overall sample (the method of extraction was the Maximum Likelihood
Method, while the selected rotation was Direct Oblimin rotation). Be-
fore the analysis, all measurement items were checked for normality of
distribution (see Table 67).
The appropriateness of factor analysis was determined by examining
the correlation matrix of economic benefits items. The Bartlett’s test of
sphericity, which statistically tests for the presence of correlations among
the underlying variables, showed that the correlation matrix has signifi-
cant correlations (p < 0.05). Furthermore, the Kaiser-Meyer-Olkin meas-
ure of sampling adequacy was 0.885, which indicates an excellent sample
adequacy.
After consideration of each item’s communality index and its con-
tribution, we retained all the items (the lowest communality after ex-
traction was 0.459). The number of expected factors was one, and the
extracted factor was one. In addition, the scree plot of the initial run in-
dicated one factor as an appropriate number. Further, one factor explains
65.087% of variance.