Page 214 - Hojnik, Jana. 2017. In Persuit of Eco-innovation. Drivers and Consequences of Eco-innovation at Firm Level. Koper: University of Primorska Press
P. 214
In Pursuit of Eco-innovation
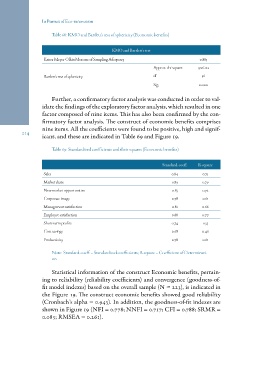
Table 68: KMO and Bartlett’s test of sphericity (Economic benefits)
KMO and Bartlett’s test
Kaiser-Meyer-Olkin Measure of Sampling Adequacy 0.885
1926.122
Approx. chi-square
36
Bartlett’s test of sphericity df 0.000
Sig.
Further, a confirmatory factor analysis was conducted in order to val-
idate the findings of the exploratory factor analysis, which resulted in one
factor composed of nine items. This has also been confirmed by the con-
firmatory factor analysis. The construct of economic benefits comprises
nine items. All the coefficients were found to be positive, high and signif-
214 icant, and these are indicated in Table 69 and Figure 19.
Table 69: Standardized coefficients and their squares (Economic benefits)
Sales Standard. coeff. R-square
Market share
New market opportunities 0.84 0.71
Corporate image 0.89 0.79
Management satisfaction 0.85 0.72
Employee satisfaction 0.78 0.61
Short-term profits 0.81 0.66
Cost savings 0.88 0.77
Productivity 0.74 0.55
0.68 0.46
0.78 0.61
Note: Standard. coeff. = Standardized coefficients; R-square = Coefficient of Determinati-
on.
Statistical information of the construct Economic benefits, pertain-
ing to reliability (reliability coefficients) and convergence (goodness-of-
fit model indexes) based on the overall sample (N = 223), is indicated in
the Figure 19. The construct economic benefits showed good reliability
(Cronbach’s alpha = 0.943). In addition, the goodness-of-fit indexes are
shown in Figure 19 (NFI = 0.778; NNFI = 0.717; CFI = 0.788; SRMR =
0.083; RMSEA = 0.261).