Page 216 - Hojnik, Jana. 2017. In Persuit of Eco-innovation. Drivers and Consequences of Eco-innovation at Firm Level. Koper: University of Primorska Press
P. 216
In Pursuit of Eco-innovation
ing the parsimony of the construct. We first eliminated the items that
had lower extracted communalities and were correlated to a lower extent
with other items, then again conducted exploratory factor analysis. If we
appeared to be on the right track, we continued with confirmatory fac-
tor analysis and examined the goodness-of-fit indexes as well as the stand-
ardized coefficients. We repeated this procedure several times to find the
best solution.
We now present the results of the best solution. We conducted an ex-
ploratory factor analysis (the method of extraction was the Maximum
Likelihood Method, while the selected rotation was Direct Oblimin ro-
tation). The appropriateness of factor analysis was determined by exam-
ining the correlation matrix of economic benefits items. The Bartlett’s
test of sphericity, which statistically tests for the presence of correlations
216 among the underlying variables, showed that the correlation matrix has
significant correlations (p < 0.05). Furthermore, the Kaiser-Meyer-Olkin
measure of sampling adequacy was 0.846 (with nine items, the KMO val-
ue was 0.885), which means an excellent sample adequacy.
After consideration of each item’s communality index and its contri-
bution, we retained all the items (the lowest communality after extrac-
tion was 0.631, while with all nine items the lowest one was 0.459). In the
process of analysis, researchers usually delete or exclude the items that
have low communalities after extraction – below the threshold of 0.20.
Here, we have deleted all the items with communality less than 0.60.
The number of expected factors was one, and the extracted factor was
one. In addition, the scree plot of the initial run indicated one factor as
an appropriate number. Further, one factor explains 77.242% of variance
(with all nine items, the share of explained variance was 65.087%).
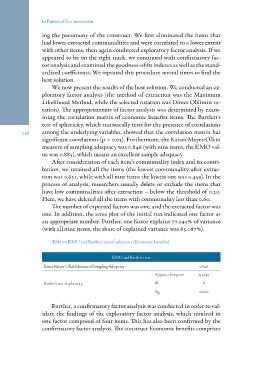
Table 70: KMO and Bartlett’s test of sphericity (Economic benefits)
KMO and Bartlett’s test
Kaiser-Meyer-Olkin Measure of Sampling Adequacy 0.846
753.649
Approx. chi-square
6
Bartlett’s test of sphericity df 0.000
Sig.
Further, a confirmatory factor analysis was conducted in order to val-
idate the findings of the exploratory factor analysis, which resulted in
one factor composed of four items. This has also been confirmed by the
confirmatory factor analysis. The construct Economic benefits comprises
ing the parsimony of the construct. We first eliminated the items that
had lower extracted communalities and were correlated to a lower extent
with other items, then again conducted exploratory factor analysis. If we
appeared to be on the right track, we continued with confirmatory fac-
tor analysis and examined the goodness-of-fit indexes as well as the stand-
ardized coefficients. We repeated this procedure several times to find the
best solution.
We now present the results of the best solution. We conducted an ex-
ploratory factor analysis (the method of extraction was the Maximum
Likelihood Method, while the selected rotation was Direct Oblimin ro-
tation). The appropriateness of factor analysis was determined by exam-
ining the correlation matrix of economic benefits items. The Bartlett’s
test of sphericity, which statistically tests for the presence of correlations
216 among the underlying variables, showed that the correlation matrix has
significant correlations (p < 0.05). Furthermore, the Kaiser-Meyer-Olkin
measure of sampling adequacy was 0.846 (with nine items, the KMO val-
ue was 0.885), which means an excellent sample adequacy.
After consideration of each item’s communality index and its contri-
bution, we retained all the items (the lowest communality after extrac-
tion was 0.631, while with all nine items the lowest one was 0.459). In the
process of analysis, researchers usually delete or exclude the items that
have low communalities after extraction – below the threshold of 0.20.
Here, we have deleted all the items with communality less than 0.60.
The number of expected factors was one, and the extracted factor was
one. In addition, the scree plot of the initial run indicated one factor as
an appropriate number. Further, one factor explains 77.242% of variance
(with all nine items, the share of explained variance was 65.087%).
Table 70: KMO and Bartlett’s test of sphericity (Economic benefits)
KMO and Bartlett’s test
Kaiser-Meyer-Olkin Measure of Sampling Adequacy 0.846
753.649
Approx. chi-square
6
Bartlett’s test of sphericity df 0.000
Sig.
Further, a confirmatory factor analysis was conducted in order to val-
idate the findings of the exploratory factor analysis, which resulted in
one factor composed of four items. This has also been confirmed by the
confirmatory factor analysis. The construct Economic benefits comprises