Page 218 - Hojnik, Jana. 2017. In Persuit of Eco-innovation. Drivers and Consequences of Eco-innovation at Firm Level. Koper: University of Primorska Press
P. 218
In Pursuit of Eco-innovation
Note: Measurement items: Q18A = Sales; Q18B = Market share; Q18C = New market oppor-
tunities; Q18F = Employee satisfaction; Chi-square = 1.907; p = 0.385; Goodness-of-fit indexes:
NFI = 0.997; NNFI = 1.000; CFI = 1.000; SRMR = 0.008; RMSEA = 0.000; Reliability coeffici-
ents: Cronbach’s alpha = 0.930; RHO = 0.930; Internal consistency reliability = 0.950.
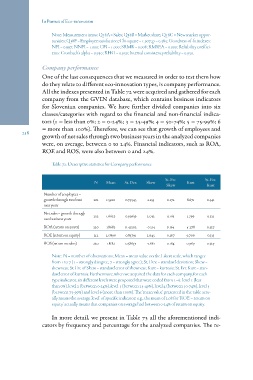
Company performance
One of the last consequences that we measured in order to test them how
do they relate to different eco-innovation types, is company performance.
All the indexes presented in Table 72 were acquired and gathered for each
company from the GVIN database, which contains business indicators
for Slovenian companies. We have further divided companies into six
classes/categories with regard to the financial and non-financial indica-
tors (1 = less than 0%; 2 = 0-24%; 3 = 25-49%; 4 = 50-74%; 5 = 75-99%; 6
= more than 100%). Therefore, we can see that growth of employees and
218 growth of net sales through two business years in the analyzed companies
were, on average, between 0 to 24%. Financial indicators, such as ROA,
ROE and ROS, were also between 0 and 24%.
Table 72: Descriptive statistics for Company performance
N Mean St. Dev. Skew St. Err. Kurt St. Err.
Skew Kurt
Number of employees –
growth through two busi- 201 1.5920 0.79545 2.253 0.172 8.671 0.341
ness years
Net sales – growth through 222 1.6622 0.92639 2.032 0.163 5.799 0.325
two business years
ROA (return on assets) 220 1.8682 0.41202 -0.514 0.164 4.278 0.327
ROE (return on equity) 212 2.0896 0.85791 2.645 0.167 9.706 0.333
ROS (return on sales) 220 1.8182 0.38657 -1.661 0.164 0.767 0.327
Note: N = number of observations; Mean = mean value on the Likert scale, which ranges
from 1 to 7 (1 = strongly disagree, 7 = strongly agree); St. Dev. = standard deviation; Skew =
skewness; St. Err. of Skew = standard error of skewness; Kurt = kurtosis; St. Err. Kurt = stan-
dard error of kurtosis. Furthermore, when we acquired the data for each company, for each
type indicator, six different levels were proposed that were coded from 1–6: level 1 (less
than 0%), level 2 (between 0-24%), level 3 (between 25-49%), level 4 (between 50-74%), level 5
(between 75-99%) and level 6 (more than 100%). The ‘mean value’ presented in the table actu-
ally means the average ‘level’ of specific indicator; e.g., the mean of 2.08 for ‘ROE – return on
equity’ actually means that companies on average had between 0-24% of return on equity.
In more detail, we present in Table 73 all the aforementioned indi-
cators by frequency and percentage for the analyzed companies. The re-
Note: Measurement items: Q18A = Sales; Q18B = Market share; Q18C = New market oppor-
tunities; Q18F = Employee satisfaction; Chi-square = 1.907; p = 0.385; Goodness-of-fit indexes:
NFI = 0.997; NNFI = 1.000; CFI = 1.000; SRMR = 0.008; RMSEA = 0.000; Reliability coeffici-
ents: Cronbach’s alpha = 0.930; RHO = 0.930; Internal consistency reliability = 0.950.
Company performance
One of the last consequences that we measured in order to test them how
do they relate to different eco-innovation types, is company performance.
All the indexes presented in Table 72 were acquired and gathered for each
company from the GVIN database, which contains business indicators
for Slovenian companies. We have further divided companies into six
classes/categories with regard to the financial and non-financial indica-
tors (1 = less than 0%; 2 = 0-24%; 3 = 25-49%; 4 = 50-74%; 5 = 75-99%; 6
= more than 100%). Therefore, we can see that growth of employees and
218 growth of net sales through two business years in the analyzed companies
were, on average, between 0 to 24%. Financial indicators, such as ROA,
ROE and ROS, were also between 0 and 24%.
Table 72: Descriptive statistics for Company performance
N Mean St. Dev. Skew St. Err. Kurt St. Err.
Skew Kurt
Number of employees –
growth through two busi- 201 1.5920 0.79545 2.253 0.172 8.671 0.341
ness years
Net sales – growth through 222 1.6622 0.92639 2.032 0.163 5.799 0.325
two business years
ROA (return on assets) 220 1.8682 0.41202 -0.514 0.164 4.278 0.327
ROE (return on equity) 212 2.0896 0.85791 2.645 0.167 9.706 0.333
ROS (return on sales) 220 1.8182 0.38657 -1.661 0.164 0.767 0.327
Note: N = number of observations; Mean = mean value on the Likert scale, which ranges
from 1 to 7 (1 = strongly disagree, 7 = strongly agree); St. Dev. = standard deviation; Skew =
skewness; St. Err. of Skew = standard error of skewness; Kurt = kurtosis; St. Err. Kurt = stan-
dard error of kurtosis. Furthermore, when we acquired the data for each company, for each
type indicator, six different levels were proposed that were coded from 1–6: level 1 (less
than 0%), level 2 (between 0-24%), level 3 (between 25-49%), level 4 (between 50-74%), level 5
(between 75-99%) and level 6 (more than 100%). The ‘mean value’ presented in the table actu-
ally means the average ‘level’ of specific indicator; e.g., the mean of 2.08 for ‘ROE – return on
equity’ actually means that companies on average had between 0-24% of return on equity.
In more detail, we present in Table 73 all the aforementioned indi-
cators by frequency and percentage for the analyzed companies. The re-