Page 269 - Hojnik, Jana. 2017. In Persuit of Eco-innovation. Drivers and Consequences of Eco-innovation at Firm Level. Koper: University of Primorska Press
P. 269
Eco-innovation models
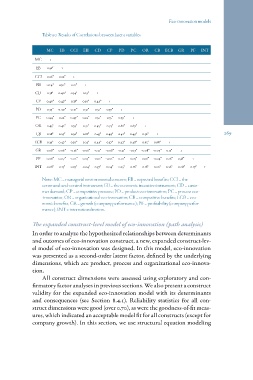
Table 90: Results of Correlations between latent variables
MC EB CCI EII CD CP PD PC OR CB ECB GR PF INT 269
MC 1
EB 0.56* 1
CCI 0.26* 0.22* 1
EII 0.24* 0.30* 0.21* 1
CD 0.38* 0.40* 0.54* 0.19* 1
CP 0.46* 0.47* 0.38* 0.30* 0.49* 1
PD 0.37* 0.40* 0.41* 0.31* 0.51* 0.59* 1
PC 0.44* 0.22* 0.47* 0.22* 0.51* 0.55* 0.79* 1
OR 0.45* 0.42* 0.39* 0.31* 0.47* 0.73* 0.66* 0.69* 1
CB 0.28* 0.29* 0.36* 0.18* 0.45* 0.49* 0.41* 0.49* 0.56* 1
ECB 0.39* 0.47* 0.30* 0.23* 0.49* 0.57* 0.47* 0.48* 0.65* 0.68* 1
GR 0.08* 0.06* -0.36* -0.06* -0.11* -0.08* -0.21* -0.17* -0.08* -0.07* 0.13* 1
PF 0.06* 0.07* -0.12* 0.05* -0.02* -0.02* 0.01* 0.05* 0.06* -0.04* 0.26* 0.38* 1
INT 0.08* 0.13* 0.29* -0.04* 0.37* 0.04* 0.25* 0.16* 0.18* 0.20* 0.26* -0.08* -0.17* 1
Note: MC = managerial environmental concern; EB = expected benefits; CCI = the
command-and-control instrument; EII = the economic incentive instrument; CD = custo-
mer demand; CP = competitive pressure; PD = product eco-innovation; PC = process eco-
-innovation; OR = organizational eco-innovation; CB = competitive benefits; ECB = eco-
nomic benefits; GR = growth (company performance); PF = profitability (company perfor-
mance); INT = internationalization.
The expanded construct-level model of eco-innovation (path analysis)
In order to analyze the hypothesized relationships between determinants
and outomes of eco-innovation construct, a new, expanded construct-lev-
el model of eco-innovation was designed. In this model, eco-innovation
was presented as a second-order latent factor, defined by the underlying
dimensions, which are product, process and organizational eco-innova-
tion.
All construct dimensions were assessed using exploratory and con-
firmatory factor analyses in previous sections. We also present a construct
validity for the expanded eco-innovation model with its determinants
and consequences (see Section 8.4.1). Reliability statistics for all con-
struct dimensions were good (over 0.70), as were the goodness-of-fit meas-
ures, which indicated an acceptable model fit for all constructs (except for
company growth). In this section, we use structural equation modeling