Page 257 - Hojnik, Jana. 2017. In Persuit of Eco-innovation. Drivers and Consequences of Eco-innovation at Firm Level. Koper: University of Primorska Press
P. 257
Eco-innovation models 257
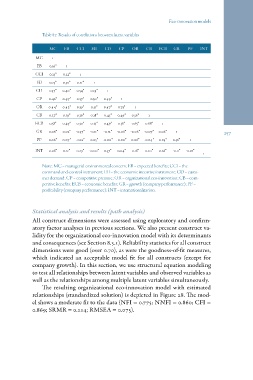
Table 87: Results of correlations between latent variables
MC EB CCI EII CD CP OR CB ECB GR PF INT
MC 1
EB 0.56* 1
CCI 0.25* 0.22* 1
EII 0.23* 0.30* 0.21* 1
CD 0.37* 0.40* 0.54* 0.19* 1
CP 0.46* 0.47* 0.37* 0.30* 0.49* 1
OR 0.44* 0.42* 0.39* 0.31* 0.47* 0.73* 1
CB 0.27* 0.29* 0.36* 0.18* 0.45* 0.49* 0.56* 1
ECB 0.38* 0.47* 0.30* 0.23* 0.49* 0.56* 0.65* 0.68* 1
GR 0.06* 0.02* -0.37* -0.11* -0.12* -0.06* -0.06* -0.07* 0.06* 1
PF 0.06* 0.07* -0.12* 0.05* -0.00* -0.00* 0.06* -0.04* 0.03* 0.36* 1
INT 0.08* 0.12* 0.29* -0.00* 0.37* 0.04* 0.18* 0.20* 0.26* -0.11* -0.01* 1
Note: MC = managerial environmental concern; EB = expected benefits; CCI = the
command-and-control instrument; EII = the economic incentive instrument; CD = custo-
mer demand; CP = competitive pressure; OR = organizational eco-innovation; CB = com-
petitive benefits; ECB = economic benefits; GR = growth (company performance); PF =
profitability (company performance); INT = internationalization.
Statistical analysis and results (path analysis)
All construct dimensions were assessed using exploratory and confirm-
atory factor analyses in previous sections. We also present construct va-
lidity for the organizational eco-innovation model with its determinants
and consequences (see Section 8.3.1). Reliability statistics for all construct
dimensions were good (over 0.70), as were the goodness-of-fit measures,
which indicated an acceptable model fit for all constructs (except for
company growth). In this section, we use structural equation modeling
to test all relationships between latent variables and observed variables as
well as the relationships among multiple latent variables simultaneously.
The resulting organizational eco-innovation model with estimated
relationships (standardized solution) is depicted in Figure 28. The mod-
el shows a moderate fit to the data (NFI = 0.775; NNFI = 0.860; CFI =
0.869; SRMR = 0.214; RMSEA = 0.075).