Page 220 - Hojnik, Jana. 2017. In Persuit of Eco-innovation. Drivers and Consequences of Eco-innovation at Firm Level. Koper: University of Primorska Press
P. 220
Pursuit of Eco-innovation
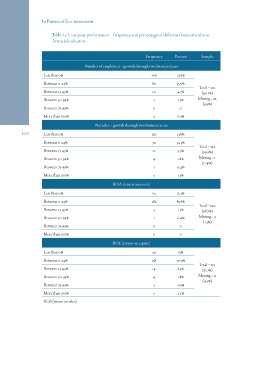
Table 73: Company performance – frequency and percentage of different financial and non-
-financial indicators
Frequency Percent Sample
Number of employees – growth through two business years
Less than 0% 106 47.5%
Between 0-24%
Between 25-49% 80 35.9%
Between 50-74% Total = 201
Between 75-99%
More than 100% 10 4.5% (90.1%)
3 1.3% Missing = 22
(9.9%)
00
2 0.9%
220 Less than 0% Net sales – growth through two business years 53.8% Total = 222
32.3% (99.6%)
Between 0-24% 120 9.9%
Between 25-49% 72 1.8% Missing = 1
Between 50-74% 22 0.4% (0.4%)
Between 75-99% 4 1.3%
More than 100% 1
3
ROA (return on assets)
Less than 0% 34 15.2%
Between 0-24%
Between 25-49% 182 81.6%
Between 50-74% Total = 220
Between 75-99%
More than 100% 3 1.3% (98.7%)
1 0.4% Missing = 3
(1.3%)
00
00
ROE (return on equity)
Less than 0% 29 13%
Between 0-24%
Between 25-49% 158 70.9%
Between 50-74% Total = 212
Between 75-99%
More than 100% 14 6.3% (95.1%)
ROS (return on sales) 4 1.8% Missing = 11
(4.9%)
2 0.9%
5 2.2%