Page 221 - Hojnik, Jana. 2017. In Persuit of Eco-innovation. Drivers and Consequences of Eco-innovation at Firm Level. Koper: University of Primorska Press
P. 221
Results
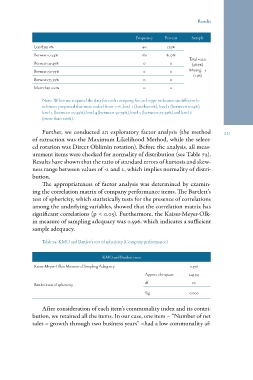
Less than 0% Frequency Percent Sample
Between 0-24%
Between 25-49% 40 17.9% Total = 220
Between 50-74% 180 80.7% (98.7%)
Between 75-99% 0
More than 100% 0 0 Missing = 3
0 0 (1.3%)
0 0
0
Note: When we acquired the data for each company, for each type indicator, six different le-
vels were proposed that were coded from 1–6: level 1 (less than 0%), level 2 (between 0-24%),
level 3 (between 25-49%), level 4 (between 50-74%), level 5 (between 75-99%) and level 6
(more than 100%).
Further, we conducted an exploratory factor analysis (the method 221
of extraction was the Maximum Likelihood Method, while the select-
ed rotation was Direct Oblimin rotation). Before the analysis, all meas-
urement items were checked for normality of distribution (see Table 72).
Results have shown that the ratio of standard errors of kurtosis and skew-
ness range between values of -2 and 2, which implies normality of distri-
bution.
The appropriateness of factor analysis was determined by examin-
ing the correlation matrix of company performance items. The Bartlett’s
test of sphericity, which statistically tests for the presence of correlations
among the underlying variables, showed that the correlation matrix has
significant correlations (p < 0.05). Furthermore, the Kaiser-Meyer-Olk-
in measure of sampling adequacy was 0.596, which indicates a sufficient
sample adequacy.
Table 74: KMO and Bartlett’s test of sphericity (Company performance)
KMO and Bartlett’s test
Kaiser-Meyer-Olkin Measure of Sampling Adequacy 0.596
243.333
Approx. chi-square
10
Bartlett’s test of sphericity df
0.000
Sig.
After consideration of each item’s communality index and its contri-
bution, we retained all the items. In our case, one item – “Number of net
sales – growth through two business years” –had a low communality af-