Page 223 - Hojnik, Jana. 2017. In Persuit of Eco-innovation. Drivers and Consequences of Eco-innovation at Firm Level. Koper: University of Primorska Press
P. 223
Results 223
Next, exploratory factor analysis was conducted only for items per-
taining to the construct company profitability. The method of extraction
was the Maximum Likelihood Method, while the selected rotation was
Direct Oblimin rotation. The appropriateness of factor analysis was de-
termined by examining the correlation matrix of company profitability
items. The Bartlett’s test of sphericity showed that the correlation ma-
trix has significant correlations (p < 0.05). Furthermore, the Kaiser-Mey-
er-Olkin measure of sampling adequacy was 0.596, which indicates a suf-
ficient sample adequacy. After consideration of each item’s communality
index and its contribution, we retained all the items. All items had values
above the threshold of 0.20 (the lowest communality was 0.276). As ex-
pected, the scree plot of the initial run indicated that one factor might be
an appropriate number, and the latent root (eigenvalue) criterion also in-
dicated one factor, which in total explains 58.904% of variance.
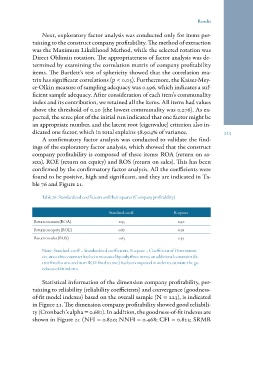
A confirmatory factor analysis was conducted to validate the find-
ings of the exploratory factor analysis, which showed that the construct
company profitability is composed of three items: ROA (return on as-
sets), ROE (return on equity) and ROS (return on sales). This has been
confirmed by the confirmatory factor analysis. All the coefficients were
found to be positive, high and significant, and they are indicated in Ta-
ble 76 and Figure 21.
Table 76: Standardized coefficients and their squares (Company profitability)
Return on assets (ROA) Standard. coeff. R-square
Return on equity (ROE) 0.95 0.90
Return on sales (ROS) 0.87 0.76
0.63 0.39
Note: Standard. coeff. = Standardized coefficients; R-square = Coefficient of Determinati-
on; since this construct has been measured by only three items, an additional constraint (fa-
ctor fixed to one and item ROE fixed to one) has been imposed in order to estimate the go-
odness-of-fit indexes.
Statistical information of the dimension company profitability, per-
taining to reliability (reliability coefficients) and convergence (goodness-
of-fit model indexes) based on the overall sample (N = 223), is indicated
in Figure 21. The dimension company profitability showed good reliabili-
ty (Cronbach’s alpha = 0.681). In addition, the goodness-of-fit indexes are
shown in Figure 21 (NFI = 0.820; NNFI = 0.468; CFI = 0.823; SRMR
Next, exploratory factor analysis was conducted only for items per-
taining to the construct company profitability. The method of extraction
was the Maximum Likelihood Method, while the selected rotation was
Direct Oblimin rotation. The appropriateness of factor analysis was de-
termined by examining the correlation matrix of company profitability
items. The Bartlett’s test of sphericity showed that the correlation ma-
trix has significant correlations (p < 0.05). Furthermore, the Kaiser-Mey-
er-Olkin measure of sampling adequacy was 0.596, which indicates a suf-
ficient sample adequacy. After consideration of each item’s communality
index and its contribution, we retained all the items. All items had values
above the threshold of 0.20 (the lowest communality was 0.276). As ex-
pected, the scree plot of the initial run indicated that one factor might be
an appropriate number, and the latent root (eigenvalue) criterion also in-
dicated one factor, which in total explains 58.904% of variance.
A confirmatory factor analysis was conducted to validate the find-
ings of the exploratory factor analysis, which showed that the construct
company profitability is composed of three items: ROA (return on as-
sets), ROE (return on equity) and ROS (return on sales). This has been
confirmed by the confirmatory factor analysis. All the coefficients were
found to be positive, high and significant, and they are indicated in Ta-
ble 76 and Figure 21.
Table 76: Standardized coefficients and their squares (Company profitability)
Return on assets (ROA) Standard. coeff. R-square
Return on equity (ROE) 0.95 0.90
Return on sales (ROS) 0.87 0.76
0.63 0.39
Note: Standard. coeff. = Standardized coefficients; R-square = Coefficient of Determinati-
on; since this construct has been measured by only three items, an additional constraint (fa-
ctor fixed to one and item ROE fixed to one) has been imposed in order to estimate the go-
odness-of-fit indexes.
Statistical information of the dimension company profitability, per-
taining to reliability (reliability coefficients) and convergence (goodness-
of-fit model indexes) based on the overall sample (N = 223), is indicated
in Figure 21. The dimension company profitability showed good reliabili-
ty (Cronbach’s alpha = 0.681). In addition, the goodness-of-fit indexes are
shown in Figure 21 (NFI = 0.820; NNFI = 0.468; CFI = 0.823; SRMR