Page 263 - Hojnik, Jana. 2017. In Persuit of Eco-innovation. Drivers and Consequences of Eco-innovation at Firm Level. Koper: University of Primorska Press
P. 263
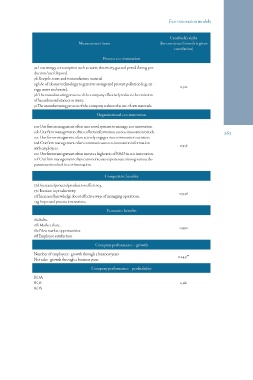
Eco-innovation models
Measurement items Cronbach’s alpha
(for construct Growth is given
correlation)
Process eco-innovation
9a Low energy consumption such as water, electricity, gas and petrol during pro- 0.912
duction/use/disposal.
9b Recycle, reuse and remanufacture material.
9g Use of cleaner technology to generate savings and prevent pollution (e.g., en-
ergy, water and waste).
9h The manufacturing process of the company effectively reduces the emission
of hazardous substances or waste.
9i The manufacturing process of the company reduces the use of raw materials.
Organizational eco-innovation
10a Our firm management often uses novel systems to manage eco-innovation. 263
10b Our firm management often collects information on eco-innovation trends.
10c Our firm management often actively engages in eco-innovation activities. 0.956
10d Our firm management often communicates eco-innovation information
with employees.
10e Our firm management often invests a high ratio of R&D in eco-innovation.
10f Our firm management often communicates experiences among various de-
partments involved in eco-innovation.
Competitive benefits 0.946
0.930
17d Increased process/production efficiency. 0.249**
17e Increase in productivity. 0.681
17f Increased knowledge about effective ways of managing operations.
17g Improved process innovations.
Economic benefits
18a Sales.
18b Market share.
18c New market opportunities.
18f Employee satisfaction.
Company performance – growth
Number of employees - growth through 2 business years
Net sales - growth through 2 business years
Company performance – profitability
ROA
ROE
ROS